The mtext() function in R is used to write text in the margins of a plot.
The following method shows how you can do it with syntax.
Method 1: Use mtext() Function
mtext("Text", side = x, line = y)
The following example shows how to use mtext() function in R to write text in margins of plot.
Using mtext() Function
Let’s see how we can use mtext() function in R:
# Create dataframe
df <- data.frame(Machine_name=c("A","B","C","D","E","F","G","H"),
                 Temperature=c(12,9,14,13,18,28,22,23),
                 Pressure=c(20,25,27,29,30,32,39,40))

# Create scatterplot
plot(df$Temperature,df$Pressure)

# Add text above plot
mtext("This is scatterplot")
Output:
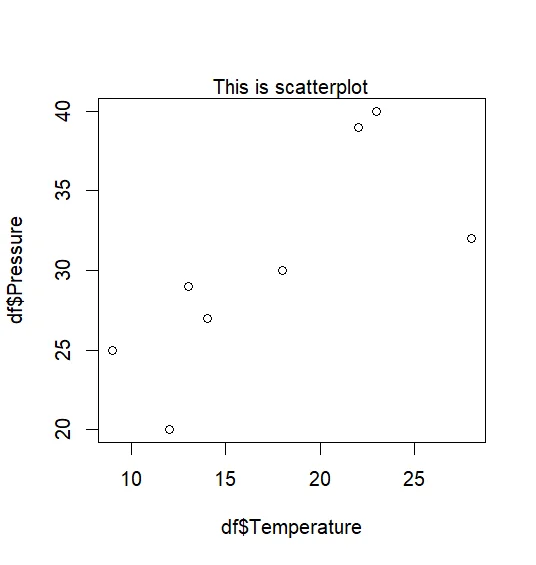
The above snippet shows scatterplot with text added above the plot.
You can use pass multiple parameters to mtext() function:
# Create dataframe
df <- data.frame(Machine_name=c("A","B","C","D","E","F","G","H"),
                 Temperature=c(12,9,14,13,18,28,22,23),
                 Pressure=c(20,25,27,29,30,32,39,40))

# Create scatterplot
plot(df$Temperature,df$Pressure)

# Add text above plot
mtext("This is scatterplot", side=3, line=-3, cex=2, col='red')
Output:
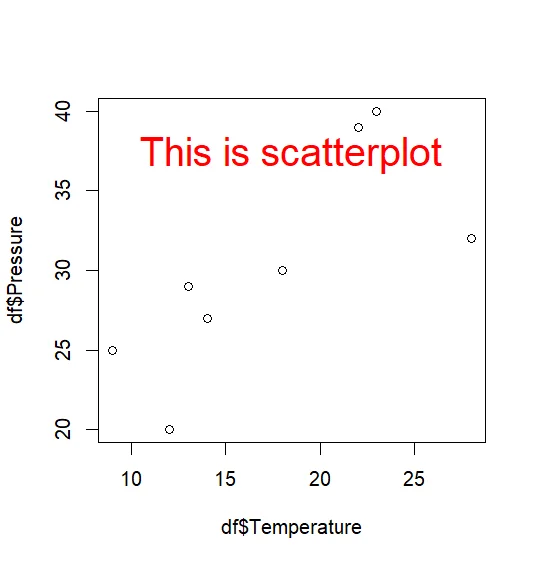
The above snippet shows scatter plot with blue colored text added above plot.