One Sample $t$-Test for mean
In this tutorial we will discuss some numerical examples on one sample t-test for testing population mean when population standard deviation is unknown. This tutorial will show you step by step procedure to solve numerical examples on one sample t-test for population mean.
Example 1
The Healthy Food Company claims that its cereal boxes contain, on average, 453 grams of cereal. We suspect that the cereal boxes contain, on average, less than claimed. You decided to test the claim by inspecting 6 randomly selected boxes, and get the following weights:
454, 447, 452, 446, 450, 445.
Assume that the amount of cereal in a box follows a normal distribution. Test at 5% level of significance.
Solution
Given that the sample size $n = 6$, sample mean $\overline{x}= 449$ and sample standard deviation $s = 3.578$.
Step 1 Hypothesis Testing Problem
The hypothesis testing problem is
$H_0 : \mu = 453$ against $H_1 : \mu < 453$ ($\text{left-tailed}$)
Step 2 Test Statistic
The test statistic is
$$ \begin{aligned} t& =\frac{\overline{x} -\mu}{s/\sqrt{n}} \end{aligned} $$
which follows $t$ distribution with $n-1$ degrees of freedom.
Step 3 Significance Level
The significance level is $\alpha = 0.05$.
Step 4 Critical Value(s)
As the alternative hypothesis is $\text{left-tailed}$, the critical value of $t$ $\text{is}$ $-2.015$.
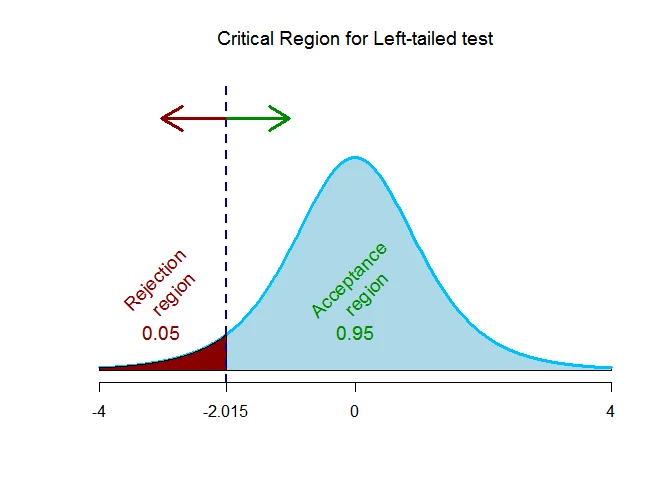
The rejection region (i.e. critical region) is $\text{t < -2.015}$.
Step 5 Computation
The test statistic under the null hypothesis is
$$ \begin{aligned} t&=\frac{ \overline{x} -\mu_0}{s/\sqrt{n}}\\ &= \frac{449-453}{3.578/ \sqrt{6 }}\\ &= -2.738 \end{aligned} $$
Step 6 Decision (Traditional Approach)
The test statistic is $t =-2.738$ which falls $\text{inside}$ the critical region, we $\text{reject}$ the null hypothesis.
OR
Step 6 Decision ($p$-value Approach)
This is a $\text{left-tailed}$ test, so the p-value is the area to the left of the test statistic ($t=-2.738$) is p-value = $0.0204$.
The p-value is $0.0204$ which is $\text{less than}$ the significance level of $\alpha = 0.05$, we $\text{reject}$ the null hypothesis.
Example 2
A new brand of laptop battery is produced by a company. The company claims that the battery will last for an extended period of time before a recharge is necessary. A sample of 40 batteries is tested for the length of usage time to recharge. The sample results are as follows:
Sample Size = 40
Sample Mean = 6.5 hrs.
Sample Standard Deviation = 1.3 hrs.
At the 0.01 level of significance, is there evidence that the population mean length of usage is greater than 5.5 hours?
Solution
Given that the sample size $n = 40$, sample mean $\overline{x}= 6.5$ and sample standard deviation $s = 1.3$.
Step 1 Hypothesis Testing Problem
The hypothesis testing problem is
$H_0 : \mu = 5.5$ against $H_1 : \mu > 5.5$ ($\text{right-tailed}$)
Step 2 Test Statistic
The test statistic is
$$ \begin{aligned} t& =\frac{\overline{x} -\mu}{s/\sqrt{n}} \end{aligned} $$
which follows $t$ distribution with $n-1$ degrees of freedom.
Step 3 Significance Level
The significance level is $\alpha = 0.01$.
Step 4 Critical Value(s)
As the alternative hypothesis is $\text{right-tailed}$, the critical value of $t$ $\text{is}$ $2.426$.
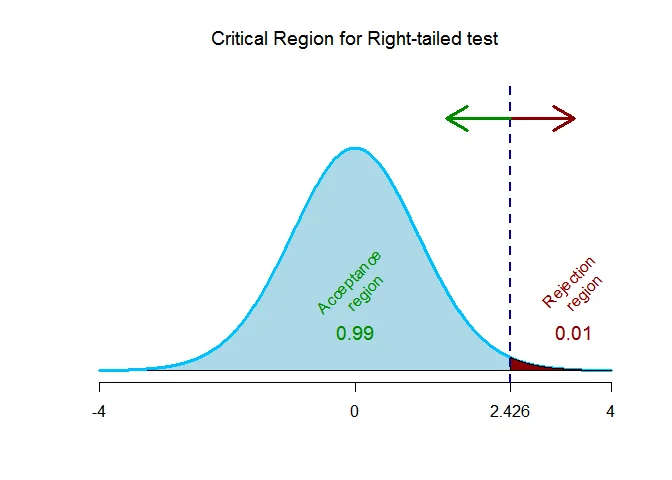
The rejection region (i.e. critical region) is $\text{t > 2.426}$.
Step 5 Computation
The test statistic under the null hypothesis is
$$ \begin{aligned} t&=\frac{ \overline{x} -\mu_0}{s/\sqrt{n}}\\ &= \frac{6.5-5.5}{1.3/ \sqrt{40 }}\\ &= 4.865 \end{aligned} $$
Step 6 Decision (Traditional Approach)
The test statistic is $t =4.865$ which falls $\text{inside}$ the critical region, we $\text{reject}$ the null hypothesis.
OR
Step 6 Decision ($p$-value Approach)
This is a $\text{right-tailed}$ test, so the p-value is the area to the left of the test statistic ($t=4.865$) is p-value = $0$.
The p-value is $0$ which is $\text{less than}$ the significance level of $\alpha = 0.01$, we $\text{reject}$ the null hypothesis.
Example 3
A special cable manufactured by a company has a breaking strength of 800 pounds. (Assume the breaking strength is normally distributed.) A researcher selects a random sample of 20 cables and finds the average breaking strength is 793 pounds with a standard deviation of 12 pounds. Do these data support the claim that the average breaking strength is not 800 pounds? Test at the 0.05 level of significance.
Solution
Given that the sample size $n = 20$, sample mean $\overline{x}= 793$ and sample standard deviation $s = 12$.
Step 1 Hypothesis Testing Problem
The hypothesis testing problem is
$H_0 : \mu = 800$ against $H_1 : \mu \neq 800$ ($\text{two-tailed}$)
Step 2 Test Statistic
The test statistic is
$$ \begin{aligned} t& =\frac{\overline{x} -\mu}{s/\sqrt{n}} \end{aligned} $$
which follows $t$ distribution with $n-1$ degrees of freedom.
Step 3 Significance Level
The significance level is $\alpha = 0.05$.
Step 4 Critical Value(s)
As the alternative hypothesis is $\text{two-tailed}$, the critical value of $t$ $\text{are}$ $-2.093$ and $2.093$.
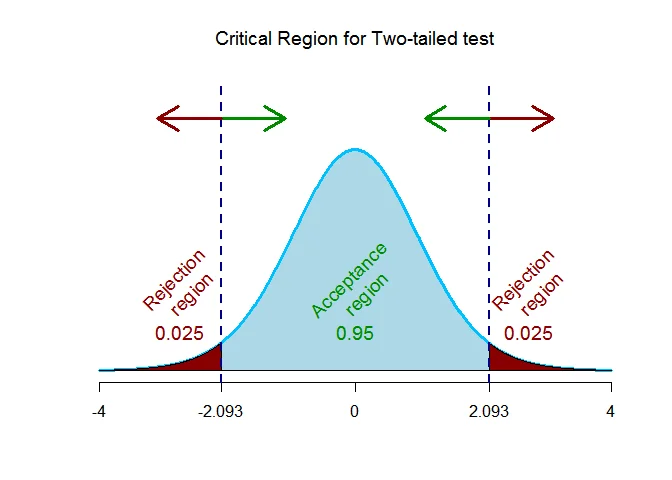
The rejection region (i.e. critical region) is $\text{t < -2.093 or t > 2.093}$.
Step 5 Computation
The test statistic under the null hypothesis is
$$ \begin{aligned} t&=\frac{ \overline{x} -\mu_0}{s/\sqrt{n}}\\ &= \frac{793-800}{12/ \sqrt{20 }}\\ &= -2.609 \end{aligned} $$
Step 6 Decision (Traditional Approach)
The test statistic is $t =-2.609$ which falls $\text{inside}$ the critical region, we $\text{reject}$ the null hypothesis.
OR
Step 6 Decision ($p$-value Approach)
This is a $\text{two-tailed}$ test, so the p-value is the area to the left of the test statistic ($t=-2.609$) is p-value = $0.0173$.
The p-value is $0.0173$ which is $\text{less than}$ the significance level of $\alpha = 0.05,$ we $\text{reject}$ the null hypothesis.
I hope this tutorial will help you to understand how to solve the numerical problems based on one-sample t-test for population mean.