Testing Homogeneity of Two Correlation Coefficient
In this tutorial we will discuss step by step solution to some problems on testing homogeneity of two correlation coefficients.
Example 1
The correlation between the mathematics scores and statistics scores of group of 50 male students is 0.358 and the correlation between the mathematics scores and statistics scores of groups of 40 female students is 0.569.
Is the relationship between mathematics scores and statistics scores for male students is weaker than for female students?
Solution
Let $\rho_1$ be the population correlation coefficient between Mathematics score and Statistics score for males and $\rho_2$ be the population correlation coefficient between Mathematics score and Statistics score for females.
Let $X$ denote the Mathematics score and $Y$ denote the Statistics score. Given that for sample of $n_1 =50$ (males) the sample correlation between $X$ and $Y$ is $0.358$ and for sample of $n_2 =40$ (female) the sample correlation between $X$ and $Y$ is $0.669$.
Step 1 Hypothesis Testing Problem
The hypothesis testing problem is $H_0 : \rho_1 = \rho_2$ against $H_1 : \rho_1 < \rho_2$ ($\text{left-tailed}$)
Step 2 Test Statistic
The test statistic for testing above hypothesis testing problem is
$$ \begin{aligned} Z&=\dfrac{Z_1-Z_2}{\sqrt{\frac{1}{n_1-3}+\frac{1}{n_2-3}}} \end{aligned} $$
where
$$ \begin{aligned} Z_1&=\frac{1}{2}\log_e \bigg(\frac{1+r_1}{1-r_1}\bigg) \end{aligned} $$
and
$$ \begin{aligned} Z_2 & =\frac{1}{2}\log_e \bigg(\frac{1+r_2}{1-r_2}\bigg) \end{aligned} $$
Under the null hypothesis the test statistic $Z$ follows $N(0,1)$ distribution.
Step 3 Significance Level
The significance level is $\alpha = 0.05$.
Step 4 Critical Value(s)
As the alternative hypothesis is $\text{left-tailed}$, the critical value of $Z$ $\text{is}$ $-1.64$ (from Normal Statistical Table).
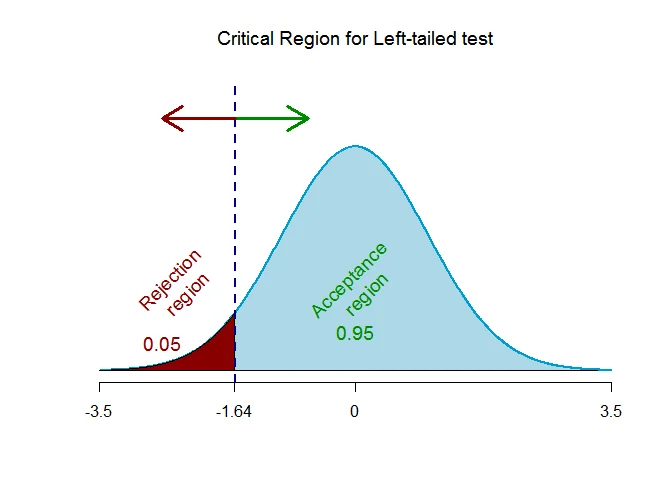
The rejection region (i.e. critical region) is $\text{Z < -1.64}$.
Step 5 Computation
$$ \begin{aligned} Z_1&=\frac{1}{2}\log_e \bigg(\frac{1+r_1}{1-r_1}\bigg)\\ &=0.5\times \log_e\bigg(\frac{1+0.358}{1-0.358}\bigg)\\ &=0.5\times \log_e\big(2.1153\big)\\ &=0.5\times 0.7492\\ &= 0.3746 \end{aligned} $$
and
$$ \begin{aligned} Z_2&=\frac{1}{2}\log_e \bigg(\frac{1+r_2}{1-r_2}\bigg)\\ &=0.5\times \log_e\bigg(\frac{1+0.669}{1-0.669}\bigg)\\ &=0.5\times \log_e\big(5.0423\big)\\ &=0.5\times 1.6179\\ &= 0.8089 \end{aligned} $$
The test statistic under the null hypothesis is
$$ \begin{aligned} Z&=\dfrac{Z_1-Z_2}{\sqrt{\frac{1}{n_1-3}+\frac{1}{n_2-3}}}\\ &=\dfrac{0.3746-0.8089}{\sqrt{\frac{1}{50-3}+\frac{1}{40-3}}}\\ &=\dfrac{-0.4343}{\sqrt{\frac{1}{47}+\frac{1}{37}}}\\ &=\dfrac{-0.4343}{0.2198}\\ &=-1.9762 \end{aligned} $$
Step 6 Decision (Traditional Approach)
The test statistic is $Z_{obs} =-1.9762$ which falls $\text{inside}$ the critical region, we $\text{reject}$ the null hypothesis at $\alpha = 0.05$ level of significance.
OR
Step 6 Decision ($p$-value Approach)
This is a $\text{left-tailed}$ test, so the p-value is the area to the $\text{left}$ of the test statistic ($Z_{obs}=-1.9762$) is p-value = $0.0241$.
The p-value is $0.0241$ which is $\text{less than}$ the significance level of $\alpha = 0.05$, we $\text{reject}$ the null hypothesis at $\alpha =0.05$ level of significance.
Interpretation
The data provide enough evidence to conclude that the relationship between mathematics scores and statistics scores in male students is weaker than that of female students.
Example 2
The correlation coefficient between weight and heart rate of 100 males is 0.3 and the correlation coefficient between weight and heart rate of 100 females is 0.5. Test whether there is significant difference between the two correlation coefficients at $\alpha=0.05$.
Solution
Let $\rho_1$ be the population correlation coefficient between weight and heart rate for males and $\rho_2$ be the population correlation coefficient between weight and heart rate for females.
Let $X$ denote the weight and $Y$ denote the heart rate. Given that for sample of $n_1 =50$ (males) the sample correlation between $X$ and $Y$ is $0.3$ and for sample of $n_2 =60$ (female) the sample correlation between $X$ and $Y$ is $0.5$.
Step 1 Hypothesis Testing Problem
The hypothesis testing problem is $H_0 : \rho_1 = \rho_2$ against $H_1 : \rho_1 \neq \rho_2$ ($\text{two-tailed}$)
Step 2 Test Statistic
The test statistic for testing above hypothesis testing problem is
$$ \begin{aligned} Z&=\dfrac{Z_1-Z_2}{\sqrt{\frac{1}{n_1-3}+\frac{1}{n_2-3}}} \end{aligned} $$
where
$$ \begin{aligned} Z_1&=\frac{1}{2}\log_e \bigg(\frac{1+r_1}{1-r_1}\bigg) \end{aligned} $$
and
$$ \begin{aligned} Z_2 & =\frac{1}{2}\log_e \bigg(\frac{1+r_2}{1-r_2}\bigg) \end{aligned} $$
Under the null hypothesis the test statistic $Z$ follows $N(0,1)$ distribution.
Step 3 Significance Level
The significance level is $\alpha = 0.05$.
Step 4 Critical Value(s)
As the alternative hypothesis is $\text{two-tailed}$, the critical value of $Z$ $\text{are}$ $-1.96 and 1.96$ (from Normal Statistical Table).
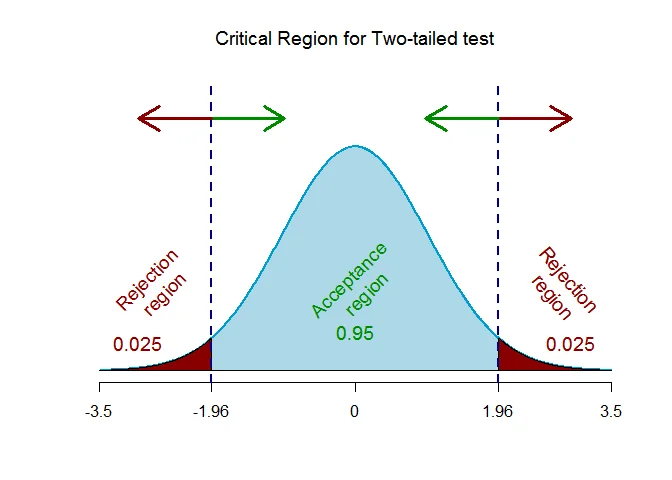
The rejection region (i.e. critical region) is $\text{Z < -1.96 or Z > 1.96}$.
Step 5 Computation
$$ \begin{aligned} Z_1&=\frac{1}{2}\log_e \bigg(\frac{1+r_1}{1-r_1}\bigg)\\ &=0.5\times \log_e\bigg(\frac{1+0.3}{1-0.3}\bigg)\\ &=0.5\times \log_e\big(1.8571\big)\\ &=0.5\times 0.619\\ &= 0.3095 \end{aligned} $$
and
$$ \begin{aligned} Z_2&=\frac{1}{2}\log_e \bigg(\frac{1+r_2}{1-r_2}\bigg)\\ &=0.5\times \log_e\bigg(\frac{1+0.5}{1-0.5}\bigg)\\ &=0.5\times \log_e\big(3\big)\\ &=0.5\times 1.0986\\ &= 0.5493 \end{aligned} $$
The test statistic under the null hypothesis is
$$ \begin{aligned} Z&=\dfrac{Z_1-Z_2}{\sqrt{\frac{1}{n_1-3}+\frac{1}{n_2-3}}}\\ &=\dfrac{0.3095-0.5493}{\sqrt{\frac{1}{50-3}+\frac{1}{60-3}}}\\ &=\dfrac{-0.2398}{\sqrt{\frac{1}{47}+\frac{1}{57}}}\\ &=\dfrac{-0.2398}{0.197}\\ &=-1.217 \end{aligned} $$
Step 6 Decision (Traditional Approach)
The test statistic is $Z_{obs} =-1.217$ which falls $\text{outside}$ the critical region, we $\text{fail to reject}$ the null hypothesis at $\alpha = 0.05$ level of significance.
OR
Step 6 Decision ($p$-value Approach)
This is a $\text{two-tailed}$ test, so the p-value is the area to the $\text{extreme}$ of the test statistic ($Z_{obs}=-1.217$) is p-value = $0.2236$.
The p-value is $0.2236$ which is $\text{greater than}$ the significance level of $\alpha = 0.05$, we $\text{fail to reject}$ the null hypothesis at $\alpha =0.05$ level of significance.
Interpretation
The data do not provide enough evidence to conclude that the relationship between weight and heart rate for males is different than that of females. That is the difference between the correlations more likely to be due to chance.