What is a Z-Score?
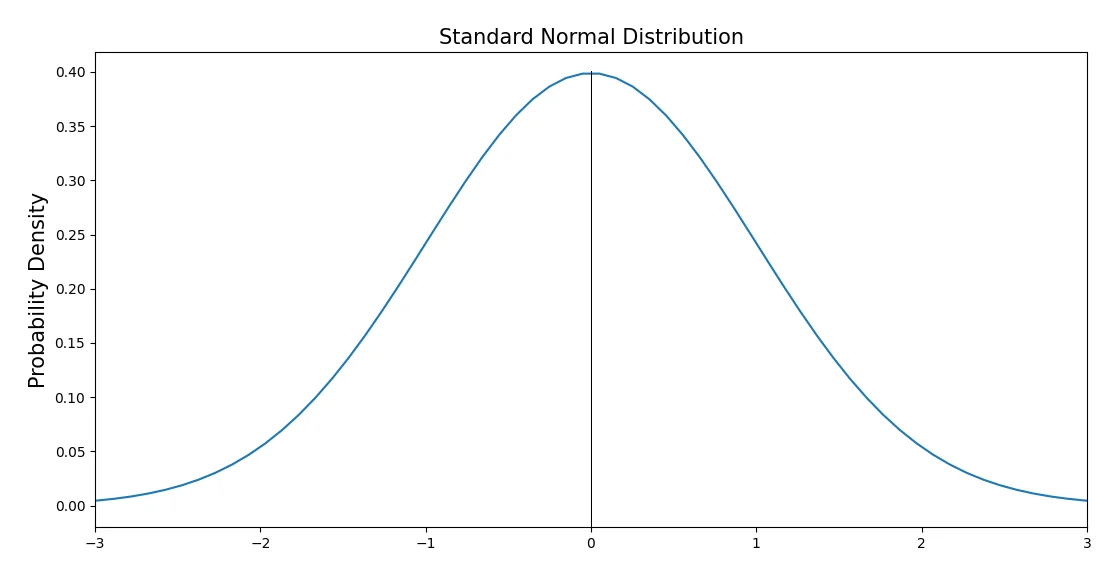
Z-score is the distance of the raw score value from the mean in terms of standard deviation. Raw scores above the mean have a positive Z-score value, while a raw score below the mean has a negative z-score value.
Z-Score is also known as the standard score because it allows the comparison of scores on different kinds of data by standardizing the distribution.
Z-Score value can be positive, negative, or zero.
Z-Score Formula
If the population mean and population standard deviation are known, the Z score is calculated using the below formula
z = (x -μ )/σ
Where:
- μ = is the population mean for the unstandardized value
- σ = is the population standard deviation for the unstandardized value
- x = is the raw score value
- z = is the calculated z-score value.
Z score value calculated using the z-score formula represents the distance of raw score x value in the units of standard deviation from the mean value.
A Z-Score formula can also be represented as below when the mean of population and population of standard deviation is unknown.
In such a case, the z score is calculated using the sample mean and sample standard deviation as below
z = (x- x̄ )/S
Where:
- x = is the raw score value
- x̄ = is the sample mean
- S = is the sample standard deviation
- z = is the calculated z score value.
Why is Z Score important?
Z score is a very useful and important statistic because
- It allows a comparison between two scores that are from different normal distributions. This is achieved by converting raw to standardized scores.
- It allows us to calculate the probability of a score occurring within the same normal distribution.
How to Calculate Z-Score?
The Z-score is a dimensionless measure since it is derived by subtracting the population mean from an individual raw score and then this difference is divided by the population standard deviation.
This computational procedure is called standardizing raw scores.
Let’s understand z score calculation with an example as given below:
Z Score Example
For example, let’s say you have scored 170 marks on the statistics test.
The Mean of the test has 135 and a standard deviation of 20. Find the Z Score.
Solution:
Using the z score formula as given below
z = (x -μ )/σ
In the above example,
- x = raw test score value = 170
- μ = mean = 135
- σ = standard deviation = 20
Input values in the z score formula to calculate the value below:
z = (170 – 135)/20 = 1.75
Z score calculated tells your score is 1.75 standard deviations above the mean as it has a positive value.
How to Interpret the Z-Score?
Z score value can be positive, negative, or zero.
- If the Z-score is zero, it tells that the raw score value is equal to the mean of the distribution, i.e. it is zero standard deviation away from the mean.
- If the Z-score is positive, it tells that the raw score value is above the mean of the distribution.
- If the Z-score is negative, it tells that the raw score value is below the mean of the distribution.
In most cases, the Z score lies within 3 standard deviations below or above the mean of the distribution.
Z-score tells us how far the raw score value is from the mean of the distribution.
It basically measures how much a raw score value is standard deviation above or below the mean of the distribution.
How Z-Score Works?
Let’s understand how the z-score works with the help of an example.
We have 20 students who appeared on the English test. Tom was among those who appeared for tests and got 70 marks out of 100.
The average score was 60 (µ) and the standard deviation was 15 (σ).
Tom wants to know how he performed in English compared to the other 20 students.
Solution:
We need to calculate the z-score for his marks to find how good his score is compared to the other 20 students.
In order to calculate the z-score, we will use the z-score formula as given below:
z = (x – μ )/σ
In the above example,
x=70 , μ = 60, σ = 15
z-score = (70-60)/15 = 0.67
Let’s find its corresponding probability using a Z-Table.
Find the first two digits on the y-axis (0.6 in our example). Then go to the x-axis to find the second decimal number (0.07 in this case).
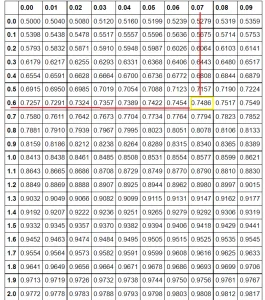
The number is 0.7486. Multiply this number by 100 to calculate its percentage.
So 0.7486 x 100 = 74.86%.
This means that almost 75% of the students scored lower than Tom and only 25% scored higher marks than Tom.
75% out of 20 students is 15. Tom did better than 15 students in his English test.
Understanding Z-Score Vs Standard Deviation
Standard Deviation: In Statistics, the standard deviation is a measure of the amount of variation of a set of values.
A low standard deviation shows that the values are close to the mean, and a high standard deviation indicates that the values are spread out over a wider range.
It gives the amount of deviation of an element from the mean but does not say the element is below or above the average.
Z-score: Z score is a measure of how many standard deviations below or above a raw element is from the mean.
The Z score not only gives the measure of the deviation of an element but also indicates the exact position of the raw score with respect to the mean.
In most large data sets, 99% of values have a Z-score between -3 and 3, meaning they lie within three standard deviations above and below the mean.
What does a lower z-score mean?
A lower z-score indicates that the data value is too many standard deviations below the mean.
The lower z-score tells us that there is a very low probability of data values below the given z-score.
For example, the below graph shows the normal standard curve for the z-score=-2.7
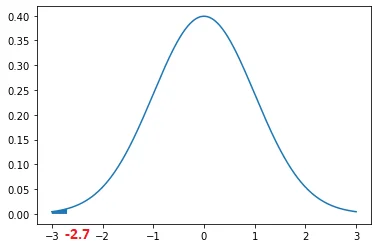
Let’s find the probability for z-score =-2.7 using the negative z-table shown below
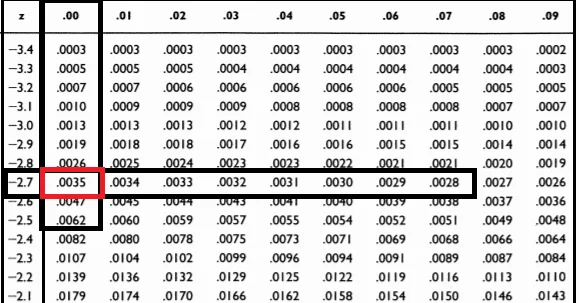
The required probability is 0.0035 i.e. 0.35% which is even less than a half percent.
So, there is only a 0.35% probability that values less than the given z-value exist which is very less.
What does a higher z-score mean?
A higher z-score indicates that the data value is positive and that many standard deviations from the mean.
The higher z-score tells us that there is a very high probability of data values above the given z-score.
The higher z-score happens sometimes due to long-tailed distribution or sometimes it highlights the outliers present in the data.
For example, the below graph shows the normal standard curve for the z-score=2.6
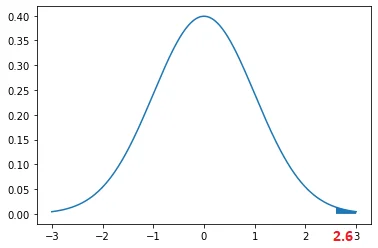
The probability for the z-score =2.6 is 0.0047 i.e. 0.47% which is even less than a half percent.
Hence, there is only a 0.47% probability that values greater than the given z-value exist which is very less.
Conclusion
I hope the above article on Z-Score is useful to you to understand concepts of z-score, z score formula, and z-score use in practical application.