Z score allows a comparison between two scores that are from different normal distributions of raw scores to standardized scores.
Z Score Formula
If the population mean and population standard deviation are known, the Z score is calculated using the below formula
z = (x -μ )/σ
Where:
- μ = is the population mean for the unstandardized value
- σ = is the population standard deviation for the unstandardized value
- x = is the raw score value
- z = is the calculated z-score value.
Using the above formula, the calculated z score represents the distance of raw score x value in the units of standard deviation from the mean value.
Z-Score Calculator
Z-score calculator calculates z-score using normal distribution raw scores, mean, and standard deviation.
| Population Mean: | ||
| Population Standard Deviation: | ||
| Raw Score Value: | ||
| Z-Score: | 0.2 | |
Using the Z score calculator, derived z-score value is used to interpret the results as given below:
- If the Z score is zero, it means the raw score value is equal to the mean of the distribution.
The Z score calculated value indicates the raw score value is zero standard deviation away from the mean of the distribution.
- If the Z score is positive, it means the raw score value is greater than the mean of the distribution.
The Z score calculated value indicates the raw score value is a standard deviation above the mean of the distribution.
- If the Z score is negative, it means the raw score value lies below the mean of the distribution.
The Z score calculated value indicates raw score value is a standard deviation below the mean of the distribution.
Let’s understand the Z score calculation using the below examples.
Example: Z Score Calculator
50 students who appeared on the SAT critical reading scores test.
Jerry was among those who appeared for tests and got 70 marks out of 100.
The average score was 60 (µ) and the standard deviation was 15 (σ).
Jerry wants to know how he performed in the credit reading scores test compared to the other 50 students.
Solution:
We need to find the Z score value for Jerry’s score and use the z table to compare his performance to the other 50 students.
Step #1: Collect input parameters
In the above example, we have below given data
-
mean or average μ=60
-
standard deviation = σ=15
-
Jerry score x = 70
Step #2: Using the Z-score formula
In order to calculate the z-score, we will use the following formula.
z = (x – μ )/σ
Step #3: Using the inputs parameters in the Z-Score formula
z-score = (70-60)/15 = 0.67
You can use the above Z score calculator to calculate the z score value using the above input parameters.
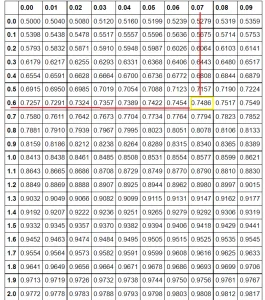
Step #4: Using Z-Table
Let’s find its corresponding probability in the Z-table.
Find the first two digits on the y-axis (0.6 in our example). Then go to the x-axis to find the second decimal number (0.07 in this case).

The corresponding area is 0.7486 which means 74.86%
Step #5: Interpret Z Score result
In the above corresponding probability is 74.86%.
It means that almost 75% of the students scored lower than Jerry and only 25% scored higher marks than Jerry.
75% out of 50 students who appear for SAT critical reading scores test is 37.5. Jerry did better than 37 students in the scores test.
Conclusion
I hope the above article to calculate the z score using the Z Score Calculator is helpful to you.
You will need the population mean or average value, population standard deviation, and raw score value to use in the z score calculator.
Using the z score, you can use the z table to find the corresponding probability.
The positive z score value in the z table corresponds to a value greater than the mean or average of the distribution.
The negative z score value in the z table corresponds to a value that is less than the mean or average of the distribution.