Confidence Interval for Mean
In this tutorial we will discuss some numerical examples to understand how to construct a confidence interval for population mean when the population standard deviation is known.
Example 1
Among those who take the Graduate Record Examination (GRE), 67 persons are randomly selected. This sample group has a mean score of 558 on the quantitative portion of the GRE. The population standard deviation is 139 (from the Educational Testing Service).
Estimate at the 98 % level the mean quantitative score on the GRE for all persons taking the test.
Solution
Given that sample size $n = 67$, sample mean $\overline{X}= 558$ and population standard deviation $\sigma = 139$.
Step 1 Specify the confidence level $(1-\alpha)$
Confidence level is $1-\alpha = 0.98$. Thus, the level of significance is $\alpha = 0.02$.
Step 2 Given information
Given that sample size $n =67$, sample mean $\overline{X}=558$ and population standard deviation is $\sigma = 139$.
Step 3 Specify the formula
$100(1-\alpha)$% confidence interval for the population mean $\mu$ is
$$ \begin{aligned} \overline{X} - E \leq \mu \leq \overline{X} + E \end{aligned} $$
where $E = Z_{\alpha/2} \frac{\sigma}{\sqrt{n}}$, and $Z_{\alpha/2}$ is the $Z$ value providing an area of $\alpha/2$ in the upper tail of the standard normal probability distribution.
Step 4 Determine the critical value
The critical value of $Z$ for given level of significance is $Z_{\alpha/2}$.
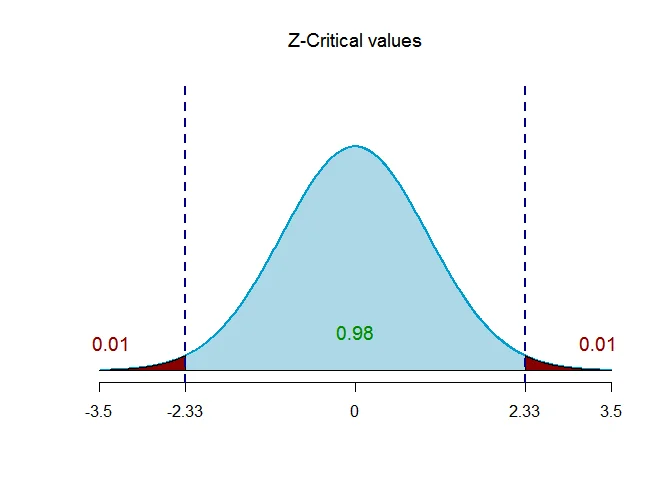
Thus $Z_{\alpha/2} = Z_{0.01} = 2.33$.
Step 5 Compute the margin of error
The margin of error for mean is
$$ \begin{aligned} E & = Z_{\alpha/2} \frac{\sigma}{\sqrt{n}}\\ & = 2.33 \frac{139}{\sqrt{67}} \\ & = 39.567. \end{aligned} $$
Step 6 Determine the confidence interval
$98$ % confidence interval estimate for population mean is
$$ \begin{aligned} \overline{X} - E & \leq \mu \leq \overline{X} + E\\ 558 - 39.567 & \leq \mu \leq 558 + 39.567\\ 518.433 & \leq \mu \leq 597.567. \end{aligned} $$
Thus, $98$% confidence interval estimate for population mean is $(518.433,597.567)$.
Interpretation
We are $98$% confident that the true population mean quantitative score on the GRE test is between $518.433$ and $597.567$.
Example 2
A sample of 81 observations is taken from a normal distribution with a standard deviation of 5. The sample mean is 40.
Determine the 95% confidence interval for the population mean.
Solution
Given that sample size $n = 81$, sample mean $\overline{X}= 40$ and population standard deviation $\sigma = 5$.
Step 1 Specify the confidence level $(1-\alpha)$
Confidence level is $1-\alpha = 0.95$. Thus, the level of significance is $\alpha = 0.05$.
Step 2 Given information
Given that sample size $n =81$, sample mean $\overline{X}=40$ and population standard deviation is $\sigma = 5$.
Step 3 Specify the formula
$100(1-\alpha)$% confidence interval for the population mean $\mu$ is
$$ \begin{aligned} \overline{X} - E \leq \mu \leq \overline{X} + E \end{aligned} $$
where $E = Z_{\alpha/2} \frac{\sigma}{\sqrt{n}}$, and $Z_{\alpha/2}$ is the $Z$ value providing an area of $\alpha/2$ in the upper tail of the standard normal probability distribution.
Step 4 Determine the critical value
The critical value of $Z$ for given level of significance is $Z_{\alpha/2}$.
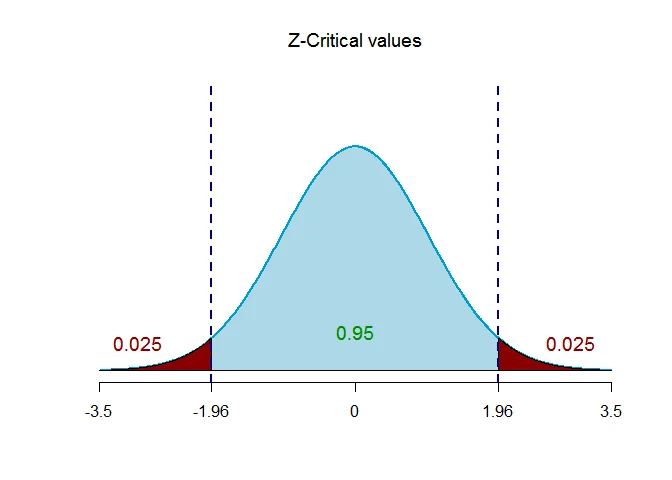
Thus $Z_{\alpha/2} = Z_{0.025} = 1.96$.
Step 5 Compute the margin of error
The margin of error for mean is
$$ \begin{aligned} E & = Z_{\alpha/2} \frac{\sigma}{\sqrt{n}}\\ & = 1.96 \frac{5}{\sqrt{81}} \\ & = 1.089. \end{aligned} $$
Step 6 Determine the confidence interval
$95$% confidence interval estimate for population mean is
$$ \begin{aligned} \overline{X} - E & \leq \mu \leq \overline{X} + E\\ 40 - 1.089 & \leq \mu \leq 40 + 1.089\\ 38.911 & \leq \mu \leq 41.089. \end{aligned} $$
Thus, $95$% confidence interval estimate for population mean is $(38.911,41.089)$.
Interpretation
We are $95$% confident that the true population mean is between $38.911$ and $41.089$.