To plot a graph in R, you can use the plot() function. This function allows you to create a variety of graphs to visualize your data.
In this article, we will explore how to create a graph in R using the plot() function with examples.
Method: Use plot() Function
The plot() function in R is used to create graphs. Here’s the syntax:
plot(x, y)
The following example shows how to plot a graph in R.
Create a Graph Using plot() Function
Let’s see how we can plot a graph for two columns of a data frame using the plot() function:
# Create data frame
df <- data.frame(Start_date=as.Date(c("2000-05-21","1998-03-28","2001-01-19","2003-04-27","2004-11-26","2008-11-25")),
                 Machine_name = c("Machine1","Machine2","Machine3","Machine4","Machine5","Machine6"),
                 Value = c(108,99,135,95,98,105),
                 Reading = c(110,97,91,89,80,85))

# Plot graph
plot(df$Value, df$Reading, main="Value vs Reading", xlab="Value", ylab="Reading", col="blue", pch=19)
Output: 👇️
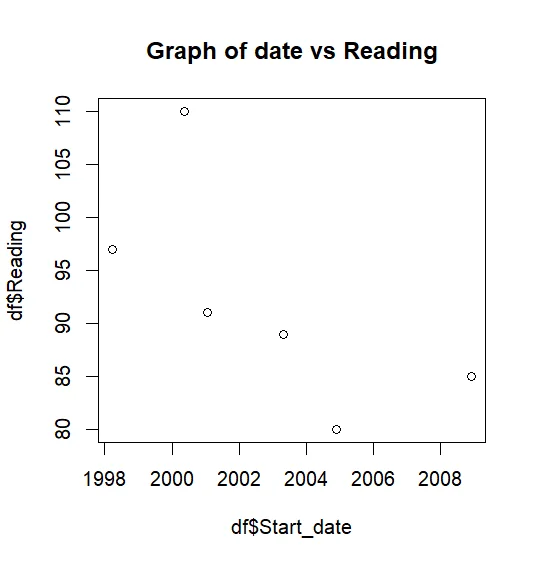
In this example, the plot() function creates a scatter plot of the Value and Reading columns from the data frame.
The main parameter sets the title of the graph, xlab and ylab set the labels for the x and y axes, col sets the color of the points, and pch sets the type of points.