The diamonds dataset is built-in dataset in ggplot2 package in R. It contains information on 53,940 round-cut diamonds, providing measurements for 10 different variables.
Let’s see how to load,explore,visualize and summarize this dataset in R.
Load Diamond Dataset
The diamond dataset is a built-in ggplot2 package, first we must to install ggplot2 package
# Install ggplot2 if not already installed
install.packages('ggplot2')

# Load ggplot2
library(ggplot2)
After installing ggplot2 you can load diamond dataset using data() function:
# Load dataset
data(diamonds)
To take look at first six rows of dataset you can use head() function:
# Get first few rows of diamonds dataset
head(diamonds)
The following output shows first 6 rows from dataset.
Output:
  carat cut       color clarity depth table price     x     y     z
  <dbl> <ord>     <ord> <ord>   <dbl> <dbl> <int> <dbl> <dbl> <dbl>
1  0.23 Ideal     E     SI2      61.5    55   326  3.95  3.98  2.43
2  0.21 Premium   E     SI1      59.8    61   326  3.89  3.84  2.31
3  0.23 Good      E     VS1      56.9    65   327  4.05  4.07  2.31
4  0.29 Premium   I     VS2      62.4    58   334  4.2   4.23  2.63
5  0.31 Good      J     SI2      63.3    58   335  4.34  4.35  2.75
6  0.24 Very Good J     VVS2     62.8    57   336  3.94  3.96  2.48
Summarize the the Diamond Dataset
You can use summary() function to summarize each variable of dataset:
# Get statistical values of dataset
summary(diamonds)
The below output shows quick summary for each of the numeric variable.
Output:
  carat               cut        color        clarity          depth           table
 Min.   :0.2000   Fair     : 1610   D: 6775   SI1    :13065   Min.   :43.00   Min.   :43.00
 1st Qu.:0.4000   Good     : 4906   E: 9797   VS2    :12258   1st Qu.:61.00   1st Qu.:56.00
 Median :0.7000   Very Good:12082   F: 9542   SI2    : 9194   Median :61.80   Median :57.00
 Mean   :0.7979   Premium  :13791   G:11292   VS1    : 8171   Mean   :61.75   Mean   :57.46
 3rd Qu.:1.0400   Ideal    :21551   H: 8304   VVS2   : 5066   3rd Qu.:62.50   3rd Qu.:59.00
 Max.   :5.0100                     I: 5422   VVS1   : 3655   Max.   :79.00   Max.   :95.00
                                    J: 2808   (Other): 2531
     price             x                y                z
 Min.   :  326   Min.   : 0.000   Min.   : 0.000   Min.   : 0.000
 1st Qu.:  950   1st Qu.: 4.710   1st Qu.: 4.720   1st Qu.: 2.910
 Median : 2401   Median : 5.700   Median : 5.710   Median : 3.530
 Mean   : 3933   Mean   : 5.731   Mean   : 5.735   Mean   : 3.539
 3rd Qu.: 5324   3rd Qu.: 6.540   3rd Qu.: 6.540   3rd Qu.: 4.040
 Max.   :18823   Max.   :10.740   Max.   :58.900   Max.   :31.800
Get Dimension of the Diamond Dataset
To get number of rows and column we use dim() function:
# Get rows and columns
dim(diamonds)
As the output shows total number of rows and columns available in dataset.
Output:
[1] 53940 10
Get Column Names of the Diamond Dataset
We use names() function to get column names of dataset:
# Get column names
names(diamonds)
The below output shows column names of dataset.
Output:
 [1] "carat"   "cut"     "color"   "clarity" "depth"   "table"   "price"   "x"       "y"
[10] "z"
Visualize the Diamond Dataset
There are different function in R to visualize dataset. Let see these functions one by one.
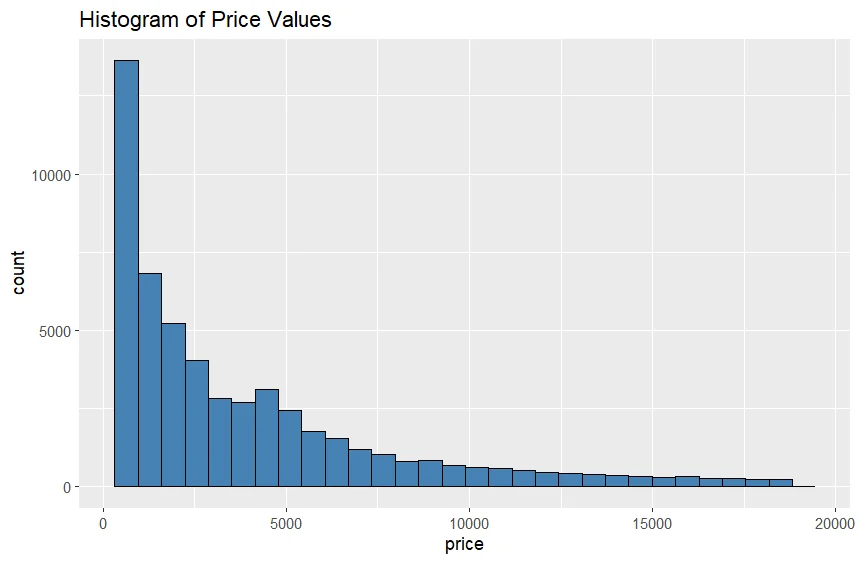
To create histogram of values for specific variables we use geom_histogram() function:
# Create histogram of values for price
ggplot(data=diamonds, aes(x=price)) +
  geom_histogram(fill="steelblue", color="black") +
  ggtitle("Histogram of Price Values")
The below snippet shows histogram for price column of dataset.
Output:

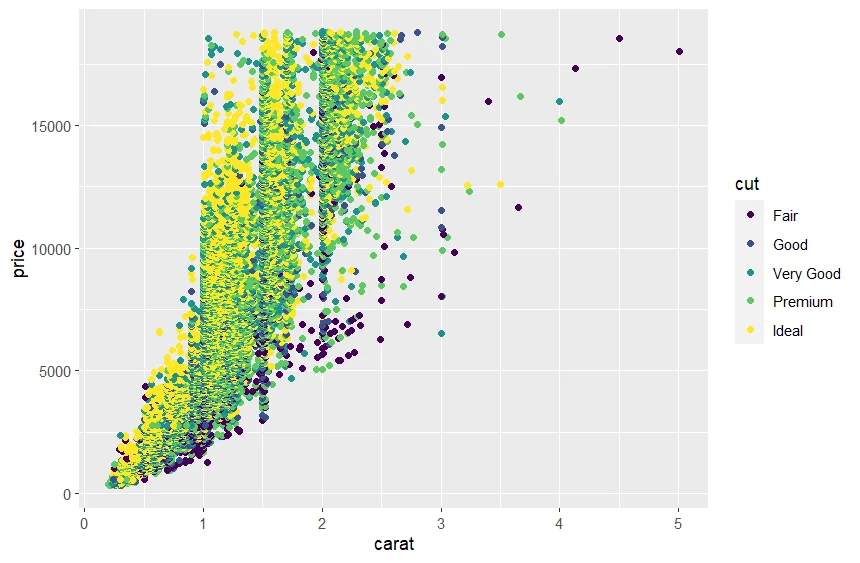
To plot scattter chart we use geom_point() function:
# Create scatterplot of carat vs. price, using cut as color variable
ggplot(data=diamonds, aes(x=carat, y=price, color=cut)) +
  geom_point()
The following snippet shows scatter chart for carat vs price column of dataset.
Output:

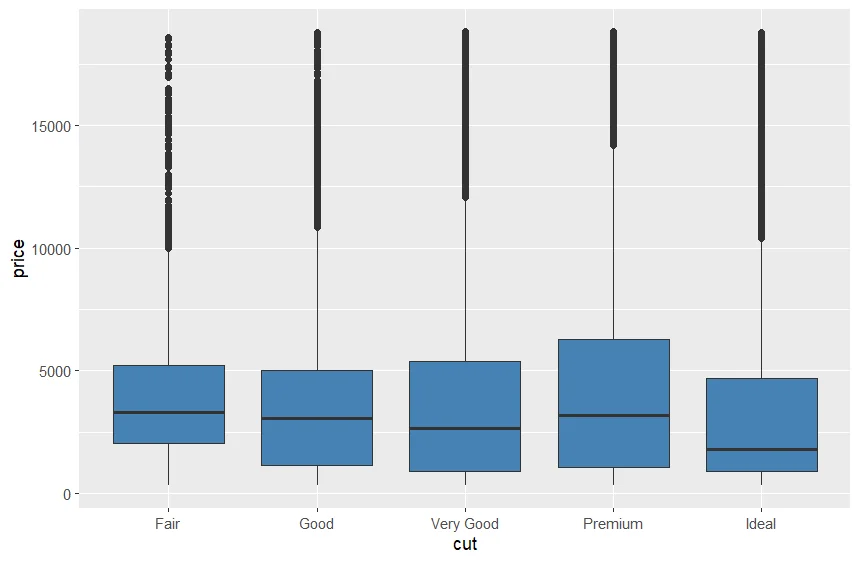
To plot the boxplot you can use geom_boxplot() function:
# Create boxplot of price, grouped by cut
ggplot(data=diamonds, aes(x=cut, y=price)) +
  geom_boxplot(fill="steelblue")
As below output shows boxplot of price column which grouped by cut column.
Output:

These are some function which used to visualize dataset.