Boston dataset from MASS package in R is widely used in statistics and machine-learning. It contains information about housing price in various suburbs in Boston, Massachusetts.
This article explains how to load,summarize and visualize Boston dataset.
Load the Boston Dataset
Before working on Boston dataset, we need to load the MASS package:
# Load library to import dataset
library(MASS)
Now we can use head() function to get the first six rows from dataset:
# Get first few rows from dataset
head(Boston)
The following output shows first six rows from Boston dataset.
Output:
 crim zn indus chas   nox    rm  age    dis rad tax ptratio  black lstat medv
1 0.00632 18  2.31    0 0.538 6.575 65.2 4.0900   1 296    15.3 396.90  4.98 24.0
2 0.02731  0  7.07    0 0.469 6.421 78.9 4.9671   2 242    17.8 396.90  9.14 21.6
3 0.02729  0  7.07    0 0.469 7.185 61.1 4.9671   2 242    17.8 392.83  4.03 34.7
4 0.03237  0  2.18    0 0.458 6.998 45.8 6.0622   3 222    18.7 394.63  2.94 33.4
5 0.06905  0  2.18    0 0.458 7.147 54.2 6.0622   3 222    18.7 396.90  5.33 36.2
6 0.02985  0  2.18    0 0.458 6.430 58.7 6.0622   3 222    18.7 394.12  5.21 28.7
To get description of each variable of dataset we can use following command:
# Get description of dataset
?Boston
Output:
Housing Values in Suburbs of Boston
Description
The Boston data frame has 506 rows and 14 columns.

Usage
Boston
Format
This data frame contains the following columns:

crim
per capita crime rate by town.

zn
proportion of residential land zoned for lots over 25,000 sq.ft.

indus
proportion of non-retail business acres per town.

chas
Charles River dummy variable (= 1 if tract bounds river; 0 otherwise).

nox
nitrogen oxides concentration (parts per 10 million).

rm
average number of rooms per dwelling.

age
proportion of owner-occupied units built prior to 1940.

dis
weighted mean of distances to five Boston employment centres.

rad
index of accessibility to radial highways.

tax
full-value property-tax rate per $10,000.

ptratio
pupil-teacher ratio by town.

black
1000(Bk−0.63)2 where Bk is the proportion of blacks by town.

lstat
lower status of the population (percent).

medv
median value of owner-occupied homes in $1000s.

Source
Harrison, D. and Rubinfeld, D.L. (1978) Hedonic prices and the demand for clean air. J. Environ. Economics and Management 5, 81–102.

Belsley D.A., Kuh, E. and Welsch, R.E. (1980) Regression Diagnostics. Identifying Influential Data and Sources of Collinearity. New York: Wiley.
Summarize the Boston Dataset
To quickly summarize each variable in dataset we can use summarize() function:
# Get statistical values
summary(Boston)
The below output shows minimum, median, mean, maxuimum, 1st quartile and 3rd quartile values for each numeric variable of dataset.
Output:
      crim                zn             indus            chas              nox
 Min.   : 0.00632   Min.   :  0.00   Min.   : 0.46   Min.   :0.00000   Min.   :0.3850
 1st Qu.: 0.08205   1st Qu.:  0.00   1st Qu.: 5.19   1st Qu.:0.00000   1st Qu.:0.4490
 Median : 0.25651   Median :  0.00   Median : 9.69   Median :0.00000   Median :0.5380
 Mean   : 3.61352   Mean   : 11.36   Mean   :11.14   Mean   :0.06917   Mean   :0.5547
 3rd Qu.: 3.67708   3rd Qu.: 12.50   3rd Qu.:18.10   3rd Qu.:0.00000   3rd Qu.:0.6240
 Max.   :88.97620   Max.   :100.00   Max.   :27.74   Max.   :1.00000   Max.   :0.8710
       rm             age              dis              rad              tax
 Min.   :3.561   Min.   :  2.90   Min.   : 1.130   Min.   : 1.000   Min.   :187.0
 1st Qu.:5.886   1st Qu.: 45.02   1st Qu.: 2.100   1st Qu.: 4.000   1st Qu.:279.0
 Median :6.208   Median : 77.50   Median : 3.207   Median : 5.000   Median :330.0
 Mean   :6.285   Mean   : 68.57   Mean   : 3.795   Mean   : 9.549   Mean   :408.2
 3rd Qu.:6.623   3rd Qu.: 94.08   3rd Qu.: 5.188   3rd Qu.:24.000   3rd Qu.:666.0
 Max.   :8.780   Max.   :100.00   Max.   :12.127   Max.   :24.000   Max.   :711.0
    ptratio          black            lstat            medv
 Min.   :12.60   Min.   :  0.32   Min.   : 1.73   Min.   : 5.00
 1st Qu.:17.40   1st Qu.:375.38   1st Qu.: 6.95   1st Qu.:17.02
 Median :19.05   Median :391.44   Median :11.36   Median :21.20
 Mean   :18.46   Mean   :356.67   Mean   :12.65   Mean   :22.53
 3rd Qu.:20.20   3rd Qu.:396.23   3rd Qu.:16.95   3rd Qu.:25.00
 Max.   :22.00   Max.   :396.90   Max.   :37.97   Max.   :50.00
Get Dimension of the Boston Dataset
We can use dim() function to get number of rows and columns in the dataset:
# Display rows and columns
dim(Boston)
As below output shows total number of rows and column of dataset.
Output:
[1] 506 14
As we can see output the dataset has 506 rows and 14 columns.
Visualize the Boston Dataset
We can visualize the values of dataset using plots.
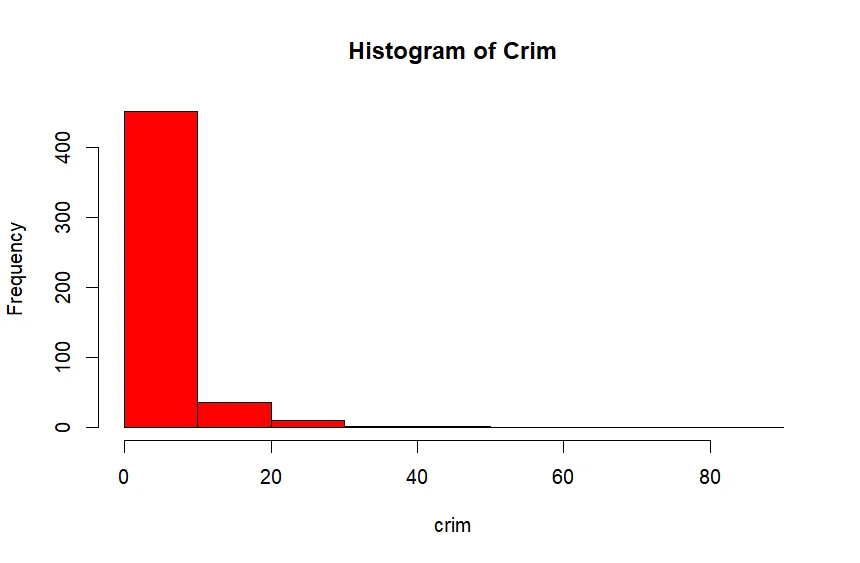
To plot histogram of values for specific variables we can use hist() function:
# Create histogram of values for 'crim' column
hist(Boston$crim,
     col='Red',
     main='Histogram of Crim',
     xlab='crim',
     ylab='Frequency')
Here we plot histogram for crim variable based on its frequency :
Output:

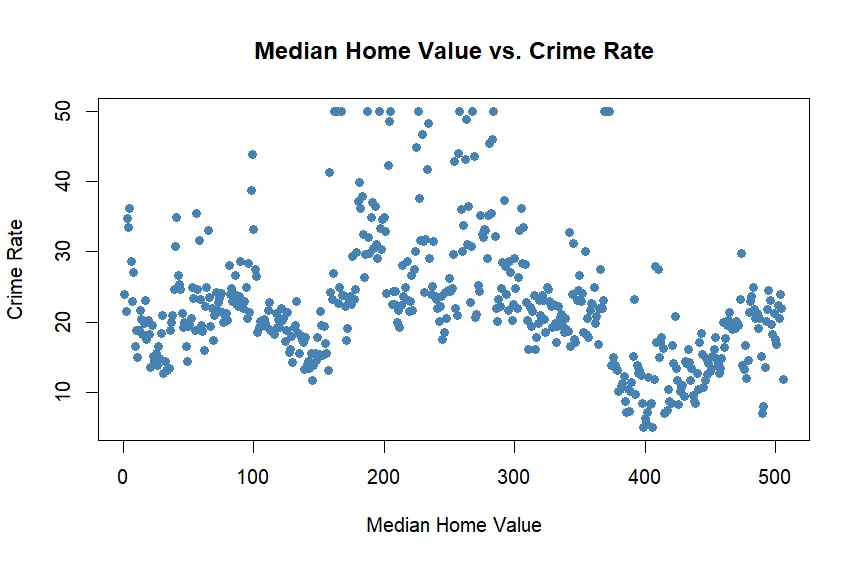
To plot scatterplot for two variables in the dataset we can use plot() function :
# Create scatterplot of median home value vs crime rate
plot(Boston$medv, Boston$crime,
     col='steelblue',
     main='Median Home Value vs. Crime Rate',
     xlab='Median Home Value',
     ylab='Crime Rate',
     pch=19)
In above code we plot scatterplot for Median Home Value and Crime Rate variables.
Output:

We can create similar scatterplot to visualize relation between any two variables of the dataset.
