F test for two variances
In this tutorial we will discuss some examples on F test for comparing two variances or standard deviations.
Example 1
A professor from a graduate school claims that there is less variability in the final exam scores of students taking the statistics major than the students taking the mathematics major. Random samples of 13 mathematics majors and 10 statistics majors are selected from the his large class, and the following results are computed based on the final exam scores:
Mathematics : $n_1= 13$, $s_1^2 = 45$
Statistics: $n_2 = 10$, $s_2^2 = 35.5$
At the 0.05 level of significance, is there evidence to support the professor’s claim?
Solution
Let $X$ denote the final exam scores of students taking the mathematics major and $Y$ denote the final exam scores of students taking the statistics major.
| Summary | Mathematics Major | Statistics Major |
|---|---|---|
| Sample size | $n_1= 13$ | $n_2=10$ |
| Sample variance | $s_1^2 = 45$ | $s_2^2 = 35.5$ |
Step 1 Hypothesis testing problem
The hypothesis testing problem is
$H_0 : \sigma^2_1 = \sigma^2_2$ against $H_1 : \sigma^2_1 >\sigma^2_2$ ($\textit{right-tailed}$)
Step 2 Test Statistic
The test statistic for testing above hypothesis testing problem is
$$ \begin{aligned} F=\frac{s_1^2}{s_2^2} \end{aligned} $$
The test statistic $F$ follows $F$ distribution with $13-1 = 12$ and $10-1= 9$ degrees of freedom.
Step 3 Level of significance
The significance level is $\alpha = 0.05$.
Step 4 Critical value(s)
As the alternative hypothesis is $\textit{right-tailed}$, the critical value of $F$ for $12$ and $9$ degrees of freedom and $\alpha = 0.05$ level of significance $\text{is}$ $\text{3.073}$.
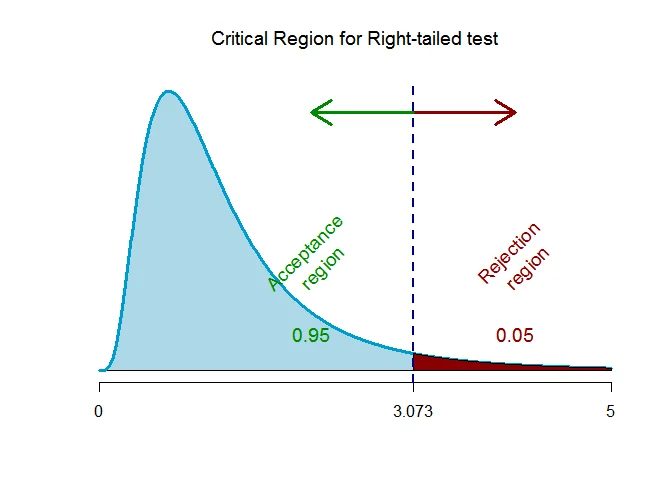
The rejection region (i.e. critical region) is $\text{F > 3.073}$.
Step 5 Computation
The test statistic under the null hypothesis is
$$ \begin{aligned} F_{obs} &=\frac{s_1^2}{s_2^2}\\ &= \frac{45}{35.5}\\ &= 1.2676 \end{aligned} $$
Step 6 Decision (Traditional approach)
The test statistic is $F_{obs} =1.2676$ which falls $\textit{outside}$ the critical region, we $\textit{fail to reject}$ the null hypothesis.
OR
Step 6 Decision ($p$-value approach)
This is a $\textit{right-tailed}$ test, so the p-value is the area to the left of the test statistic ($F_{obs}=1.2676$) is p-value = $0.3674$.
The p-value is $0.3674$ which is $\textit{greater than}$ the significance level of $\alpha = 0.05$, we $\textit{fail to reject}$ the null hypothesis.
Interpretation
There is no sufficient evidence to support the claim that variability in the final exam scores of students taking the statistics major is less than the students taking the mathematics major.
Example 2
The same capacity of hard drive is manufactured on two different machines, Machine A and Machine B. Samples are taken from both machines and sample mean manufacturing times and sample variances are recorded. The table shows the data. Test the belief that the variation in manufacturing times is more with Machine A than with Machine B. Use a 5% level of significance.
Machine A: $n_1=13$, $\overline{x}= 127.4$, $s_1^2= 384.16$
Machine B: $n_2=9$, $\overline{y}= 108.3$, $s_2^2 =106.09$
Solution
Let $X$ denote the manufacturing time for hard drive by machine A and let $Y$ denote the manufacturing time for hard drive by machine B. Given data is as follows:
| Summary | Machine A | Machine B |
|---|---|---|
| Sample size | $n_1= 13$ | $n_2=9$ |
| Sample variance | $s_1^2 = 384.16$ | $s_2^2 = 106.09$ |
Step 1 Hypothesis testing problem
The hypothesis testing problem is
$H_0 : \sigma^2_1 = \sigma^2_2$ against $H_1 : \sigma^2_1 >\sigma^2_2$ ($\textit{right-tailed}$)
Step 2 Test Statistic
The test statistic for testing above hypothesis testing problem is
$$ \begin{aligned} F=\frac{s_1^2}{s_2^2} \end{aligned} $$
The test statistic $F$ follows $F$ distribution with $13-1 = 12$ and $9-1= 8$ degrees of freedom.
Step 3 Level of significance
The significance level is $\alpha = 0.05$.
Step 4 Critical value(s)
As the alternative hypothesis is $\textit{right-tailed}$, the critical value of $F$ for $12$ and $8$ degrees of freedom and $\alpha = 0.05$ level of significance $\text{is}$ $\text{3.284}$.
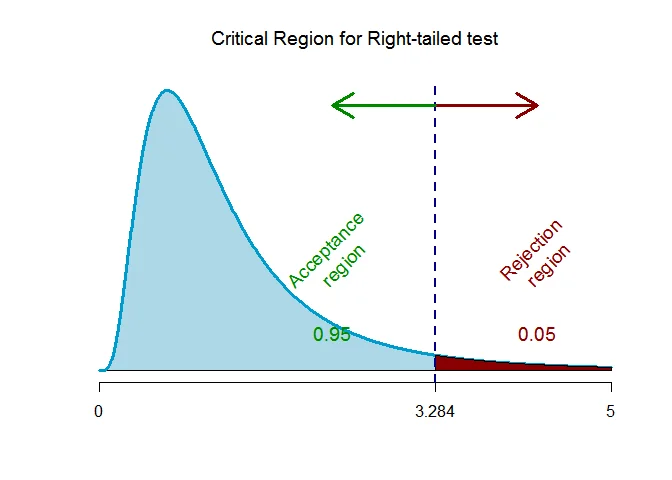
The rejection region (i.e. critical region) is $\text{F > 3.284}$.
Step 5 Computation
The test statistic under the null hypothesis is
$$ \begin{aligned} F_{obs} &=\frac{s_1^2}{s_2^2}\\ &= \frac{384.16}{106.09}\\ &= 3.6211 \end{aligned} $$
Step 6 Decision (Traditional approach)
The test statistic is $F_{obs} =3.6211$ which falls $\textit{inside}$ the critical region, we $\textit{reject}$ the null hypothesis.
OR
Step 6 Decision ($p$-value approach)
This is a $\textit{right-tailed}$ test, so the p-value is the area to the left of the test statistic ($F_{obs}=3.6211$) is p-value = $0.0382$.
The p-value is $0.0382$ which is $\textit{less than}$ the significance level of $\alpha = 0.05$, we $\textit{reject}$ the null hypothesis.
Interpretation
There is enough evidence to support the claim that variation in manufacturing times is more with Machine A than with Machine B.
Example 3
Two different brands of batteries are tested and the variations of their voltage outputs are noted. The table gives the data. At a 5% significance level, test the claim that the populations of the two brands have the same voltage variations.
Brand A: $n_1=10$, $\overline{x}= 9.31$, $s_1=0.37$
Brand B: $n_2=8$, $\overline{y}= 8.82$, $s=0.31$
Give the null and alternative hypotheses, Find the critical value of this F-test, find the test value for variances, reject null hypothesis or not, conclusion.
Solution
Let $X$ denote the voltage output for brand A batteries and $Y$ denote the voltage output for brand B batteries.
Given data is as follows :
| . | Brand A | Brand B |
|---|---|---|
| Sample Size | $n_1= 10$ | $n_2=8$ |
| Sample variance | $s_1 = 0.37$ | $s_2 = 0.31$ |
Step 1 Hypothesis testing problem
The hypothesis testing problem is
$H_0 : \sigma^2_1 = \sigma^2_2$ against $H_1 : \sigma^2_1 \neq\sigma^2_2$ ($\textit{two-tailed}$)
Step 2 Test Statistic
The test statistic for testing above hypothesis testing problem is
$$ \begin{aligned} F=\frac{s_1^2}{s_2^2} \end{aligned} $$
The test statistic $F$ follows $F$ distribution with $10-1 = 9$ and $8-1= 7$ degrees of freedom.
Step 3 Level of significance
The significance level is $\alpha = 0.1$.
Step 4 Critical value(s)
As the alternative hypothesis is $\textit{two-tailed}$, the critical value of $F$ for $9$ and $7$ degrees of freedom and $\alpha = 0.1$ level of significance $\text{are}$ $\text{0.304 and 3.677}$.
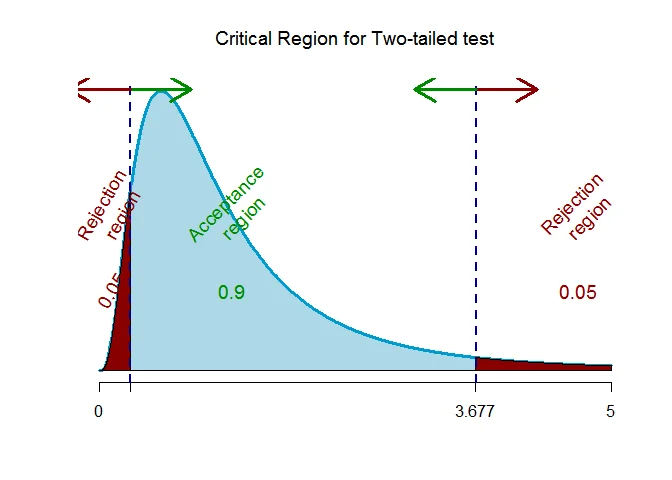
The rejection region (i.e. critical region) is $\text{F < 0.304 or F > 3.677}$.
Step 5 Computation
The test statistic under the null hypothesis is
$$ \begin{aligned} F_{obs} &=\frac{s_1^2}{s_2^2}\\ &= \frac{0.1369}{0.0961}\\ &= 1.4246 \end{aligned} $$
Step 6 Decision (Traditional approach)
The test statistic is $F_{obs} =1.4246$ which falls $\textit{outside}$ the critical region, we $\textit{fail to reject}$ the null hypothesis.
OR
Step 6 Decision ($p$-value approach)
This is a $\textit{two-tailed}$ test, so the p-value is the area to the left of the test statistic ($F_{obs}=1.4246$) is p-value = $0.6553$.
The p-value is $0.6553$ which is $\textit{greater than}$ the significance level of $\alpha = 0.1$, we $\textit{fail to reject}$ the null hypothesis.
Interpretation
There is enough evidence to support the claim that the populations of the two brands have the same voltage variations.