F-test two sample variances Calculator
Many times it is desirable to compare two variances rather than comparing two means. F test is used to compare two population variances or population standard deviations.
In this tutorial we will calculate f-test two-sample for variances calculator and six steps approach used in hypothesis testing to test whether two population variances are same or not.
F Test Statistics Formula
The f-test statistic for testing above $H_0:\sigma^2_1=\sigma^2_2$ is
$F =\frac{s_1^2}{s_2^2}$
where
-
$s_1^2 =\frac{1}{n_1-1}\sum (X_i -\overline{x})^2$is the sample variance of first sample, -
$s_2^2 =\frac{1}{n_2-1}\sum (Y_i -\overline{y})^2$is the sample variance of second sample.
The F test statistic $F$ follows $F$ distribution with $n_1-1$ and $n_2-1$ degrees of freedom.
F-test two sample for variances calculator
Use this F test calculator to calculate F test statistics,degrees of freedom,f test critical value and f test p value using two sample size,standard deviations and right/left or two tailed.
| F test Calculator for two variances | ||
|---|---|---|
| Sample 1 | Sample 2 | |
| Sample Size | ||
| Standard Deviation | ||
| Level of Significance ($\alpha$) | ||
| Tail | Left tailed Right tailed Two tailed | |
| F Test for Variance Calculator Results | ||
| Test Statistics F: | ||
| Degrees of Freedom: (df1) | ||
| Degrees of Freedom: (df2) | ||
| F-critical value(s): | ||
| p-value: | ||
How to use F test two sample variances calculator?
Step 1 - Enter the f test sample1 size
Step 2 - Enter the f test sample2 size
Step 3 - Enter the Standard Deviation for sample1 and sample2
Step 4 - Enter the level of Significance ($\alpha$)
Step 5 - Select the left tailed or right tailed or two tailed for f test calculator
Step 6 - Click on “Calculate” button to calculate f test for two variance
Step 7 - Calculate Test Statistics (F)
Step 8 - Calculate Degrees of Freedom (dF1) and df2
Step 9 - Calculate F test critical value
Step 10 - Calculate F test p value
F-Test for equality of two variances
Let $X_1, X_2, \cdots, X_{n_1}$ be a random sample of size $n_1$ from a population with variance $\sigma^2_1$ and $Y_1,Y_2, \cdots, Y_{n_2}$ be a random samples of sizes $n_2$ from a population with variance $\sigma^2_2$.
Let $\overline{x} = \frac{1}{n_1} \sum X_i$ and $s_1^2 =\frac{1}{n_1-1}\sum (X_i -\overline{x})^2$ be the sample mean and sample variance of first sample respectively.
Let $\overline{y} = \frac{1}{n_2} \sum Y_i$ and $s_2^2 =\frac{1}{n_2-1}\sum (Y_i -\overline{y})^2$ be the sample mean and sample variance of second sample respectively.
Assumptions
a. The two populations are independent.
b. The two samples are simple random samples.
c. The two populations are normally distributed.
Step by Step Procedure
Step by step procedure of f test for equality of two variances is as follows:
Step 1 State the hypothesis testing problem
The hypothesis testing problem can be structured in any one of the three situations as follows:
| Situation | Hypothesis Testing Problem |
|---|---|
| Situation A : | $H_0: \sigma^2_1=\sigma^2_2$ against $H_a : \sigma^2_1 < \sigma^2_2$ (Left-tailed) |
| Situation B : | $H_0: \sigma^2_1=\sigma^2_2$ against $H_a : \sigma^2_1 > \sigma^2_2$ (Right-tailed) |
| Situation C : | $H_0: \sigma^2_1=\sigma^2_2$ against $H_a : \sigma^2_1 \neq \sigma^2_2$ (Two-tailed) |
Step 2 Define the f test statistic
The test statistic for testing above hypothesis is
$$ F =\frac{s_1^2}{s_2^2} $$
The F test statistic follows F distribution with $n_1-1$ and $n_2-1$ degrees of freedom.
Step 3 Specify the level of significance
Specify the value of level of significance $\alpha$.
Step 4 Determine the critical values
For the specified value of $\alpha$ determine the critical region depending upon the alternative hypothesis.
- For left-tailed alternative hypothesis: Find the $t$-critical value using
$$ \begin{aligned} P(F<F_{1-\alpha, n_1-1, n_2-1}) = \alpha. \end{aligned} $$
- For right-tailed alternative hypothesis:
$$ \begin{aligned} P(F > F_{\alpha,n_1-1,n_2-1}) = \alpha. \end{aligned} $$ - For two-tailed alternative hypothesis:
$$ P(F < F_{ 1 - \alpha/2,n_1-1,n_2-1} \text{ or } F> F_{\alpha/2,n_1-1,n_2-1}) = \alpha. $$
Step 5 Computation
Compute the f test statistic under the null hypothesis $H_0$ using equation
$$ F_{obs} =\dfrac{s_1^2}{s_2^2} $$
Step 6 Decision (Traditional Approach)
It is based on the critical values.
-
For left-tailed alternative hypothesis: Reject $H_0$ if
$F_{obs}\leq F_{1-\alpha,n_1-1,n_2-1}$. -
For right-tailed alternative hypothesis: Reject $H_0$ if
$F_{obs}\geq F_{\alpha,n_1-1,n_2-1}$. -
For two-tailed alternative hypothesis: Reject $H_0$ if
$F_{obs} < F_{1-\alpha/2,n_1-1,n_2-1}$or$F_{obs} > F_{\alpha/2,n_1-1,n_2-1}$.
OR
Step 6 Decision (p-value Approach)
It is based on the $p$-value.
| Alternative Hypothesis | Type of Hypothesis | $p$-value |
|---|---|---|
| $H_a: \sigma^2_1<\sigma^2_2$ | Left-tailed | $p$-value $= P(F\leq F_{obs})$ |
| $H_a: \sigma^2_1>\sigma^2_2$ | Right-tailed | $p$-value $= P(F\geq F_{obs})$ |
| $H_a: \sigma^2_1\neq \sigma^2_2$ | Two-tailed | $p$-value $= 2P(F\geq F_{obs})$ |
If $p$-value is less than $\alpha$, then reject the null hypothesis $H_0$ at $\alpha$ level of significance, otherwise fail to reject $H_0$ at $\alpha$ level of significance.
The above six step approach helps you to understand how to test the hypothesis about the equality of two variances or equality of two standard deviations.
Let’s understand f test two sample variances with the help of examples
Example 1 - F test statistics calculator
A professor from a graduate school claims that there is less variability in the final exam scores of students taking the statistics major than the students taking the mathematics major. Random samples of 13 mathematics majors and 10 statistics majors are selected from the his large class, and the following results are computed based on the final exam scores:
Mathematics : $n_1= 13$, $s_1^2 = 45$
Statistics: $n_2 = 10$, $s_2^2 = 35.5$
At the 0.05 level of significance, is there evidence to support the professor’s claim?
Solution
Let $X$ denote the final exam scores of students taking the mathematics major and $Y$ denote the final exam scores of students taking the statistics major.
| Summary | Mathematics Major | Statistics Major |
|---|---|---|
| Sample size | $n_1= 13$ | $n_2=10$ |
| Sample variance | $s_1^2 = 45$ | $s_2^2 = 35.5$ |
Step 1 Hypothesis testing problem
The hypothesis testing problem is
$H_0 : \sigma^2_1 = \sigma^2_2$ against $H_1 : \sigma^2_1 >\sigma^2_2$ ($\textit{right-tailed}$)
Step 2 F-Test Statistic
The F test statistic for testing above hypothesis testing problem is
$$ \begin{aligned} F=\frac{s_1^2}{s_2^2} \end{aligned} $$
The test statistic $F$ follows F distribution with $13-1 = 12$ and $10-1= 9$ degrees of freedom.
Step 3 Level of significance
The significance level is $\alpha = 0.05$.
Step 4 F Critical value(s)
As the alternative hypothesis is $\textit{right-tailed}$, the $F$ critical value for $12$ and $9$ degrees of freedom and $\alpha = 0.05$ level of significance $\text{is}$ $\text{3.073}$.
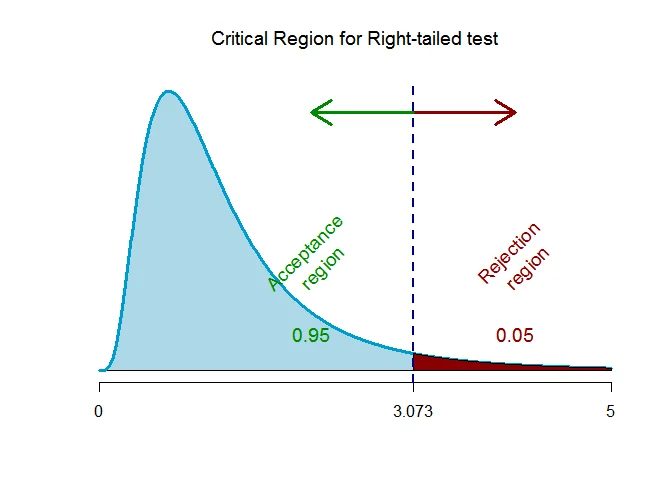
The rejection region (i.e. critical region) is $\text{F > 3.073}$.
Step 5 Computation
The F test statistics under the null hypothesis is
$$ \begin{aligned} F_{obs} &=\frac{s_1^2}{s_2^2}\\ &= \frac{45}{35.5}\\ &= 1.2676 \end{aligned} $$
Step 6 Decision (Traditional approach)
The F-test statistic is $F_{obs} =1.2676$ which falls $\textit{outside}$ the critical region, we $\textit{fail to reject}$ the null hypothesis.
OR
Step 6 Decision ($p$-value approach)
This is a $\textit{right-tailed}$ test, so the p-value is the area to the left of the test statistic ($F_{obs}=1.2676$) is p-value = $0.3674$.
The f test calculator p value is $0.3674$ which is $\textit{greater than}$ the significance level of $\alpha = 0.05$, we $\textit{fail to reject}$ the null hypothesis.
Interpretation
There is no sufficient evidence to support the claim that variability in the final exam scores of students taking the statistics major is less than the students taking the mathematics major.
Example 2 - F test two sample for variances
The same capacity of hard drive is manufactured on two different machines, Machine A and Machine B. Samples are taken from both machines and sample mean manufacturing times and sample variances are recorded. The table shows the data. Test the belief that the variation in manufacturing times is more with Machine A than with Machine B. Use a 5% level of significance.
Machine A: $n_1=13$, $\overline{x}= 127.4$, $s_1^2= 384.16$
Machine B: $n_2=9$, $\overline{y}= 108.3$, $s_2^2 =106.09$
Solution
Let $X$ denote the manufacturing time for hard drive by machine A and let $Y$ denote the manufacturing time for hard drive by machine B.
Given data is as follows:
| Summary | Machine A | Machine B |
|---|---|---|
| Sample size | $n_1= 13$ | $n_2=9$ |
| Sample variance | $s_1^2 = 384.16$ | $s_2^2 = 106.09$ |
Step 1 Hypothesis testing problem
The hypothesis testing problem is
$H_0 : \sigma^2_1 = \sigma^2_2$ against $H_1 : \sigma^2_1 >\sigma^2_2$ ($\textit{right-tailed}$)
Step 2 F Test Statistic
The F test statistics for testing above hypothesis testing problem is
$$ \begin{aligned} F=\frac{s_1^2}{s_2^2} \end{aligned} $$
The test statistic $F$ follows $F$ distribution with $13-1 = 12$ and $9-1= 8$ degrees of freedom.
Step 3 Level of significance
The significance level is $\alpha = 0.05$.
Step 4 F Critical value(s)
As the alternative hypothesis is $\textit{right-tailed}$, the $F$ critical value of for $12$ and $8$ degrees of freedom and $\alpha = 0.05$ level of significance $\text{is}$ $\text{3.284}$.
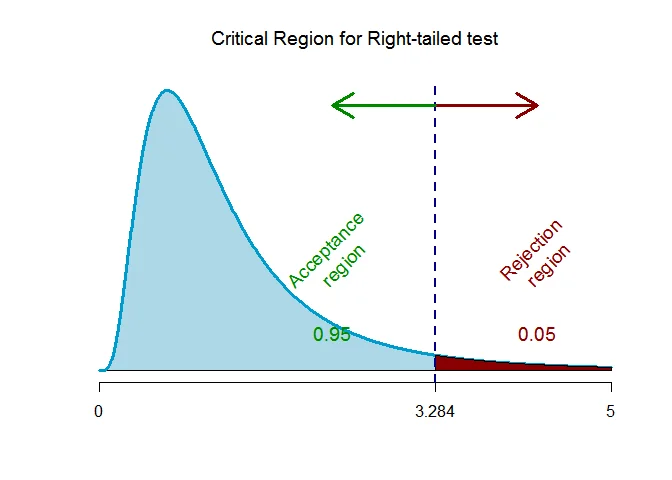
The rejection region (i.e. critical region) is $\text{F > 3.284}$.
Step 5 Computation
The f test statistic under the null hypothesis is
$$ \begin{aligned} F_{obs} &=\frac{s_1^2}{s_2^2}\\ &= \frac{384.16}{106.09}\\ &= 3.6211 \end{aligned} $$
Step 6 Decision (Traditional approach)
The test statistic is $F_{obs} =3.6211$ which falls $\textit{inside}$ the critical region, we $\textit{reject}$ the null hypothesis.
OR
Step 6 Decision ($p$-value approach)
This is a $\textit{right-tailed}$ test, so the p-value is the area to the left of the test statistic ($F_{obs}=3.6211$) is p-value = $0.0382$.
The f test calculator p value is $0.0382$ which is $\textit{less than}$ the significance level of $\alpha = 0.05$, we $\textit{reject}$ the null hypothesis.
Interpretation
There is enough evidence to support the claim that variation in manufacturing times is more with Machine A than with Machine B.
Example 3 - F test statistics Calculator
Two different brands of batteries are tested and the variations of their voltage outputs are noted. The table gives the data. At a 5% significance level, test the claim that the populations of the two brands have the same voltage variations.
Brand A: $n_1=10$, $\overline{x}= 9.31$, $s_1=0.37$
Brand B: $n_2=8$, $\overline{y}= 8.82$, $s=0.31$
Give the null and alternative hypotheses, Find the critical value of this F-test, find the f test statistics value for variances, reject null hypothesis or not, conclusion.
Solution
Let $X$ denote the voltage output for brand A batteries and $Y$ denote the voltage output for brand B batteries.
Given data is as follows :
| . | Brand A | Brand B |
|---|---|---|
| Sample Size | $n_1= 10$ | $n_2=8$ |
| Sample variance | $s_1 = 0.37$ | $s_2 = 0.31$ |
Step 1 Hypothesis testing problem
The hypothesis testing problem is
$H_0 : \sigma^2_1 = \sigma^2_2$ against $H_1 : \sigma^2_1 \neq\sigma^2_2$ ($\textit{two-tailed}$)
Step 2 F Test Statistic
The f test statistics for testing above hypothesis testing problem is
$$ \begin{aligned} F=\frac{s_1^2}{s_2^2} \end{aligned} $$
The f test statistic $F$ follows $F$ distribution with $10-1 = 9$ and $8-1= 7$ degrees of freedom.
Step 3 Level of significance
The significance level is $\alpha = 0.1$.
Step 4 F Critical value(s)
As the alternative hypothesis is $\textit{two-tailed}$, the $F$ critical value for $9$ and $7$ degrees of freedom and $\alpha = 0.1$ level of significance $\text{are}$ $\text{0.304 and 3.677}$.
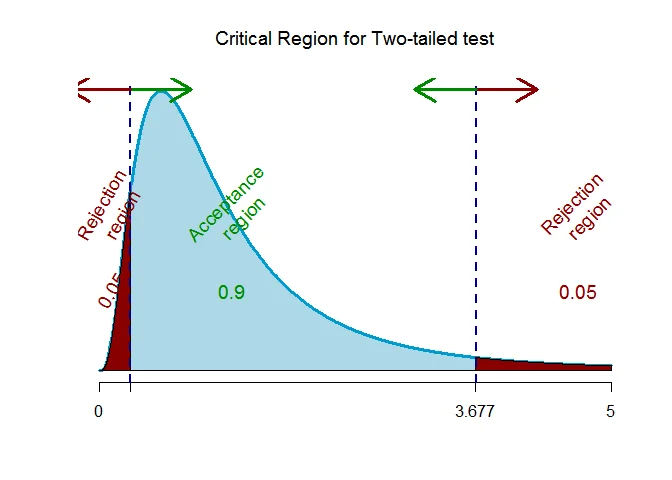
The rejection region (i.e. critical region) is $\text{F < 0.304 or F > 3.677}$.
Step 5 Computation
The f test statistic under the null hypothesis is
$$ \begin{aligned} F_{obs} &=\frac{s_1^2}{s_2^2}\\ &= \frac{0.1369}{0.0961}\\ &= 1.4246 \end{aligned} $$
Step 6 Decision (Traditional approach)
The test statistic is $F_{obs} =1.4246$ which falls $\textit{outside}$ the critical region, we $\textit{fail to reject}$ the null hypothesis.
OR
Step 6 Decision ($p$-value approach)
This is a $\textit{two-tailed}$ test, so the p-value is the area to the left of the test statistic ($F_{obs}=1.4246$) is p-value = $0.6553$.
The f test calculator p-value is $0.6553$ which is $\textit{greater than}$ the significance level of $\alpha = 0.1$, we $\textit{fail to reject}$ the null hypothesis.
Interpretation
There is enough evidence to support the claim that the populations of the two brands have the same voltage variations.
Conclusion
I hope you have find above article on f test two sample for variances calculator and examples helpful.
You can read more about F test p value calculator, other topic on paired t test calculator and chi-square test for variance calculator
Read more about other Statistics Calculator on below links