Paired t-test Calculator
Use this Paired t test calculator to calculate Test statistics t,degrees of freedom, paired t test critical value,p-value using two sample size,level of significance and right/left or two tailed.
Paired sample t-test calculator
| Paire t-test Calculator | ||
|---|---|---|
| Sample 1 | Sample 2 | |
| Enter Data (Separated by comma ,) | ||
| Level of Significance ($\alpha$) | Tail | Left tailed Right tailed Two tailed |
| Results | ||
| Number of pairs of Observation (n): | ||
| Mean of Diff.: $\overline{d}$ | ||
| Standard Deviation of D: $s_d$ | ||
| Standard Error of $\overline{d}$ | ||
| Test Statistics t: | ||
| Degrees of Freedom: | ||
| Paired t test critical value(s): | ||
| p-value: | ||
How to use Paired t test ?
Step 1 - Enter the sample1 size
Step 2 - Enter the paired t test sample2 size
Step 3 - Enter the level of Significance ($\alpha$)
Step 4 - Select the left tailed or right tailed or two tailed
Step 5 - Click on “Calculate” button to calculate paired t test
Step 6 - Calculate mean of difference
Step 7 - Calculate standard deviation
Step 8 - Calculate test statistics t
Step 9 - Calculate paired t test critical values
Step 10 - Calculate p value
Paired t-test (Dependent Sample)
Let $X_1, X_2, \cdots, X_n$ and $Y_1, Y_2, \cdots, Y_n$ be two dependent samples each of size $n$ with respective means $\mu_1$ and $\mu_2$.
Define $d_i = X_i - Y_i$, $i=1,2,\cdots, n$. Then $\mu_d= \mu_1 - \mu_2$.
Let $\overline{d}=\frac{1}{n} \sum d_i$ be the mean of the difference and $s_d=\sqrt{\frac{1}{n-1}\sum (d_i - \overline{d})^2}$ be the sample standard deviation of the difference.
The hypothesis testing problem can be set up as:
| Situation | Hypothesis Testing Problem |
|---|---|
| Situation A | $H_0: \mu_d=0$ against $H_a : \mu_d < 0$ (Left-tailed) |
| Situation B | $H_0: \mu_d=0$ against $H_a : \mu_d > 0$ (Right-tailed) |
| Situation C | $H_0: \mu_d=0$ against $H_a : \mu_d \neq 0$ (Two-tailed) |
Formula
The test statistic for testing above hypothesis is
$t=\frac{\overline{d}-\mu_d}{SE(\overline{d})}=\frac{\overline{d}-\mu_d}{s_d/\sqrt{n}}$
where
$\overline{d} =\frac{1}{n}\sum d_i$is sample mean of the difference,$s_d=\sqrt{\frac{\sum (d_i -\overline{d})^2}{n-1}}$is sample standard deviation of the difference.$SE(\overline{d}) = \frac{s_d}{\sqrt{n}}$is the standard error of $\overline{d}$.
The test statistic defined above follows Students $t$ distribution with $n-1$ degrees of freedom.
Assumptions
a. The samples are dependent (matched pairs).
b. Both the samples are simple random sample.
c. The two samples are both large ($n_1 > 30$ and $n_2 >30$) or both the samples comes from population having normal distribution.
Step by Step Procedure
We wish to test the hypothesis $H_0: \mu_1 = \mu_2$, i.e., $H_0:\mu_d=0$.
The standard error of $\overline{d}$ is
$$ \begin{aligned} SE(\overline{d}) = \frac{s_d}{\sqrt{n}} \end{aligned} $$
where $s_d$ is the sample standard deviation of the difference $d_i$.
Step 1 State the hypothesis testing problem
The hypothesis testing problem can be structured in any one of the three situations as follows:
| Situation | Hypothesis Testing Problem |
|---|---|
| Situation A | $H_0: \mu_d=0$ against $H_a : \mu_d < 0$ (Left-tailed) |
| Situation B | $H_0: \mu_d=0$ against $H_a : \mu_d > 0$ (Right-tailed) |
| Situation C | $H_0: \mu_d=0$ against $H_a : \mu_d \neq 0$ (Two-tailed) |
Step 2 Define the test statistic
The test statistic for testing above hypothesis is
$$ \begin{eqnarray*} t & =& \frac{\overline{d}-\mu_d}{SE(\overline{d})}\\ & =& \frac{\overline{d}-\mu_d}{s_d/\sqrt{n}} \end{eqnarray*} $$
where $\overline{d} =\frac{1}{n}\sum d_i$ and $s_d=\sqrt{\frac{\sum (d_i -\overline{d})^2}{n-1}}$.
The test statistic defined above follows Students t distribution with $n-1$ degrees of freedom.
Step 3 Specify the level of significance $\alpha$.
Step 4 Determine the critical values
For the specified value of $\alpha$ determine the critical region depending upon the alternative hypothesis.
- For left-tailed alternative hypothesis: Find the paired t test critical value using
$$ \begin{aligned} P(t<-t_\alpha) = \alpha. \end{aligned} $$ - For right-tailed alternative hypothesis: $t_\alpha$.
$$ \begin{aligned} P(t>t_\alpha) = \alpha. \end{aligned} $$ - For two-tailed alternative hypothesis: $t_{\alpha/2}$.
$$ P(t<-t_{\alpha/2} \text{ or } t> t_{\alpha/2}) = \alpha. $$
Step 5 Computation
Compute the test statistic under the null hypothesis $H_0$ using equation
$$ \begin{aligned} t_{obs} & = \frac{\overline{d}-0}{s_d/\sqrt{n}} \end{aligned} $$
Step 6 Decision (Traditional Approach)
It is based on the critical values.
-
For left-tailed alternative hypothesis: Reject $H_0$ if
$t_{obs}\leq -t_\alpha$. -
For right-tailed alternative hypothesis: Reject $H_0$ if
$t_{obs}\geq t_\alpha$. -
For two-tailed alternative hypothesis: Reject $H_0$ if
$|t_{obs}|\geq t_{\alpha/2}$.
OR
Step 6 Decision ($p$-value Approach)
It is based on the p-value.
| Alternative Hypothesis | Type of Hypothesis | $p$-value |
|---|---|---|
| $H_a: \mu_1<\mu_2$ | Left-tailed | $p$-value $= P(t\leq t_{obs})$ |
| $H_a: \mu_1>\mu_2$ | Right-tailed | $p$-value $= P(t\geq t_{obs})$ |
| $H_a: \mu_1\neq \mu_2$ | Two-tailed | $p$-value $= 2P(t\geq abs(t_{obs}))$ |
If p-value is less than $\alpha$, then reject the null hypothesis $H_0$ at $\alpha$ level of significance, otherwise fail to reject $H_0$ at $\alpha$ level of significance.
Let’s understand paired t test using some numerical examples.
Example 1 - Paired t test calculator
A new prep class was designed to improve AP statistics test scores. Five students were selected at random. The numbers of correct answers on two practice exams were recorded; one before the class and one after. The data recorded in the table below. We want to test if the numbers of correct answers, on average, are higher after the class.
| Student | 1 | 2 | 3 | 4 | 5 |
|---|---|---|---|---|---|
| Before Class | 12 | 15 | 9 | 12 | 12 |
| After Class | 14 | 18 | 11 | 10 | 12 |
Is there evidence to suggest that the mean number of correct answers after the class exceeds the mean number of correct answers before the class? Use $\alpha = 0.1$.
Solution
Let $x$ denote the number of correct answer before the class and $y$ denote the number of correct answer after the class.
Because the two samples are dependent, we use paired $t$-test for testing the hypothesis problem.
The sample size $n = 5$. Let $d=x-y$.
| $x$ | $y$ | $d$ | $d-\overline{d}$ | $(d-\overline{d})^2$ | |
|---|---|---|---|---|---|
| 12 | 14 | -2 | -1 | 1 | |
| 15 | 18 | -3 | -2 | 4 | |
| 9 | 11 | -2 | -1 | 1 | |
| 12 | 10 | 2 | 3 | 9 | |
| 12 | 12 | 0 | 1 | 1 | |
| Total | -5 | 16 |
The sample mean of the difference is
$$ \begin{aligned} \overline{d}&= \frac{1}{n}\sum_{i=1}^n d_i\\ &=\frac{-5}{5}\\ &=-1 \end{aligned} $$
and the sample standard deviation of the difference is
$$ \begin{aligned} s_d&= \sqrt{\frac{1}{n-1}\sum_{i=1}^n (d_i-\overline{d})^2}\\ &=\sqrt{\frac{16}{4}}\\ &=2 \end{aligned} $$
Step 1 Hypothesis
The hypothesis testing problem is $H_0 : \mu_d = 0$ against $H_1 : \mu_d < 0$ ($\textit{left-tailed}$)
Step 2 Test Statistic
The test statistic for testing $H_0$ against $H_1$ is $$ \begin{aligned} t=\frac{\overline{d} -\mu_d}{s_d/\sqrt{n}} \end{aligned} $$
Step 3 Level of Significance
The significance level is $\alpha = 0.1$.
Step 4 Critical Value(s)
As the alternative hypothesis is $\textit{left-tailed}$, the paired t test critical value for $4$ degrees of freedom and $\alpha = 0.1$ level of significance $\text{is}$ $\text{-1.533}$.
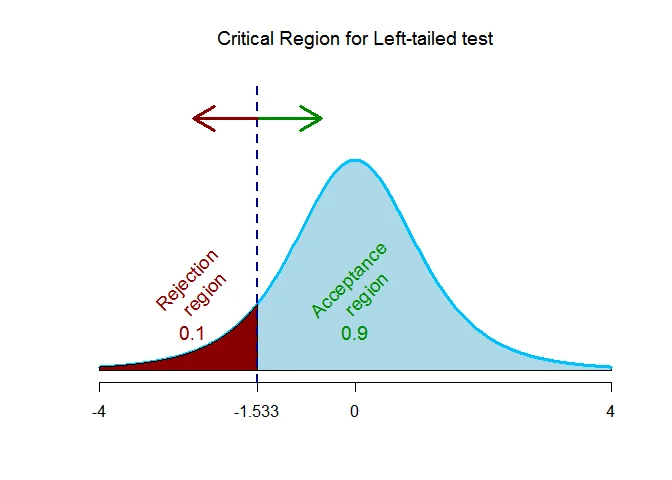
The rejection region (i.e. critical region) is $\text{t < -1.533}$.
Step 5 Computation
The test statistic for testing above hypothesis testing problem under the null hypothesis is
$$ \begin{aligned} t&=\frac{\overline{d} -\mu_d}{s_d/\sqrt{n}}\\ &= \frac{-1-0}{2/\sqrt{5}}\\ &= -1.118 \end{aligned} $$
Step 6 Decision (Traditional approach)
The test statistic is $t =-1.118$ which falls $\textit{outside}$ the critical region, we $\textit{fail to reject}$ the null hypothesis.
OR
Step 6 Decision ($p$-value approach)
The test is $\textit{left-tailed}$ test, so p-value is the area to the $\textit{left}$ of the test statistic ($t=-1.118$). That is p-value = $P(t\leq -1.118 ) = 0.1631$.
The p-value is $0.1631$ which is $\textit{greater than}$ the significance level of $\alpha = 0.1$, we $\textit{fail to reject}$ the null hypothesis at $0.1$ level of significance.
Interpretation
There is no sufficient evidence to claim that the mean number of correct answers after the class exceeds the mean number of correct answers before the class.
Example 2 Paired t test critical value
A manufacturer claims that they have designed a new keyboard that will increase the speed of a typist. A following study was done : Six students were selected at random to type a term paper on a regular keyboard and on a newly designed keyboard. Which keyboard the student types on the first was chosen at random. The following table shows the number of minutes each student took to type the term paper on each keyboard. At $\alpha =0.05$, did the newly designed keyboard reduce the number of minutes to type the paper?
| Student | A | B | C | D | E | F |
|---|---|---|---|---|---|---|
| Regular | 54 | 63 | 47 | 61 | 52 | 59 |
| Newly designed | 52 | 61 | 48 | 58 | 51 | 55 |
Solution
Let $x$ denote the number of minutes to type term paper using regular keyboard and $y$ denote the number of minutes to type term paper using newly designed keyboard.
Because the two samples are dependent, we use paired $t$-test for testing the hypothesis problem.
The sample size $n = 6$. Let $d=x-y$.
| $x$ | $y$ | $d$ | $d-\overline{d}$ | $(d-\overline{d})^2$ | |
|---|---|---|---|---|---|
| 54 | 52 | 2 | 0.167 | 0.028 | |
| 63 | 61 | 2 | 0.167 | 0.028 | |
| 47 | 48 | -1 | -2.833 | 8.028 | |
| 61 | 58 | 3 | 1.167 | 1.361 | |
| 52 | 51 | 1 | -0.833 | 0.694 | |
| 59 | 55 | 4 | 2.167 | 4.694 | |
| Total | 11 | 14.8333 |
The sample mean of the difference is
$$ \begin{aligned} \overline{d}&= \frac{1}{n}\sum_{i=1}^n d_i\\ &=\frac{11}{6}\\ &=1.8333 \end{aligned} $$
and the sample standard deviation of the difference is
$$ \begin{aligned} s_d&= \sqrt{\frac{1}{n-1}\sum_{i=1}^n (d_i-\overline{d})^2}\\ &=\sqrt{\frac{14.8333}{5}}\\ &=1.7224 \end{aligned} $$
Step 1 Hypothesis
The hypothesis testing problem is $H_0 : \mu_d = 0$ against $H_1 : \mu_d > 0$ ($\textit{right-tailed}$)
Step 2 Test Statistic
The test statistic for testing $H_0$ against $H_1$ is
$$ \begin{aligned} t=\frac{\overline{d} -\mu_d}{s_d/\sqrt{n}} \end{aligned} $$
Step 3 Level of Significance
The significance level is $\alpha = 0.05$.
Step 4 Critical Value(s)
As the alternative hypothesis is $\textit{right-tailed}$, the paired t test critical value for $5$ degrees of freedom and $\alpha = 0.05$ level of significance $\text{is}$ $\text{2.015}$.
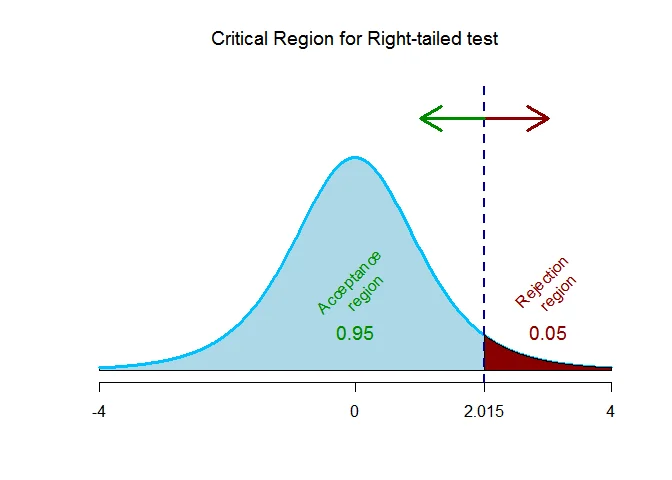
The rejection region (i.e. critical region) is $\text{t > 2.015}$.
Step 5 Computation
The test statistic for testing above hypothesis testing problem under the null hypothesis is
$$ \begin{aligned} t&=\frac{\overline{d} -\mu_d}{s_d/\sqrt{n}}\\ &= \frac{1.8333-0}{1.7224/\sqrt{6}}\\ &= 2.6072 \end{aligned} $$
Step 6 Decision (Traditional approach)
The test statistic is $t =2.6072$ which falls $\textit{inside}$ the critical region, we $\textit{reject}$ the null hypothesis.
OR
Step 6 Decision ($p$-value approach)
The test is $\textit{right-tailed}$ test, so p-value is the area to the $\textit{right}$ of the test statistic ($t=2.6072$). That is p-value = $P(t\geq 2.6072 ) = 0.0239$.
The p-value is $0.0239$ which is $\textit{less than}$ the significance level of $\alpha = 0.05$, we $\textit{reject}$ the null hypothesis at $0.05$ level of significance.
Interpretation
There is sufficient evidence to support the claim that the newly designed keyboard reduce the number of minutes to type the term paper.
Example 3 Paired t test p value calculator
Listed below are body temperatures (in $^oF$) of subjects measured at 8:00 AM and at 12:00 AM by a physician.
Is body temperature basically the same at both times? Use $\alpha = 0.05$.
| At 8:00 AM | 97.0 | 96.2 | 97.6 | 96.4 | 97.8 | 99.2 |
|---|---|---|---|---|---|---|
| At 12:00 AM | 98.0 | 98.6 | 98.8 | 98.0 | 98.6 | 97.6 |
Solution
Let $x$ denote the body temperature (in $^oF$) of subjects at 8:00 AM and $y$ denote the body temperature (in $^oF$) of subjects at 12:00 AM.
Because the two samples are dependent, we use paired $t$-test for testing the hypothesis problem.
The sample size $n = 6$. Let $d=x-y$.
| $x$ | $y$ | $d$ | $d-\overline{d}$ | $(d-\overline{d})^2$ | |
|---|---|---|---|---|---|
| 97 | 98 | -1 | -0.1 | 0.01 | |
| 96.2 | 98.6 | -2.4 | -1.5 | 2.25 | |
| 97.6 | 98.8 | -1.2 | -0.3 | 0.09 | |
| 96.4 | 98 | -1.6 | -0.7 | 0.49 | |
| 97.8 | 98.6 | -0.8 | 0.1 | 0.01 | |
| 99.2 | 97.6 | 1.6 | 2.5 | 6.25 | |
| Total | -5.4 | 9.1 |
The sample mean of the difference is
$$ \begin{aligned} \overline{d}&= \frac{1}{n}\sum_{i=1}^n d_i\\ &=\frac{-5.4}{6}\\ &=-0.9 \end{aligned} $$
and the sample standard deviation of the difference is
$$ \begin{aligned} s_d&= \sqrt{\frac{1}{n-1}\sum_{i=1}^n (d_i-\overline{d})^2}\\ &=\sqrt{\frac{9.1}{5}}\\ &=1.3491 \end{aligned} $$
Step 1 Hypothesis
The hypothesis testing problem is $H_0 : \mu_d = 0$ against $H_1 : \mu_d \neq 0$ ($\textit{two-tailed}$)
Step 2 Test Statistic
The test statistic for testing $H_0$ against $H_1$ is
$$ \begin{aligned} t=\frac{\overline{d} -\mu_d}{s_d/\sqrt{n}} \end{aligned} $$
Step 3 Level of Significance
The significance level is $\alpha = 0.05$.
Step 4 Critical Value(s)
As the alternative hypothesis is $\textit{two-tailed}$, the paired t test critical value for $5$ degrees of freedom and $\alpha = 0.05$ level of significance $\text{are}$ $\text{-2.571 and 2.571}$.
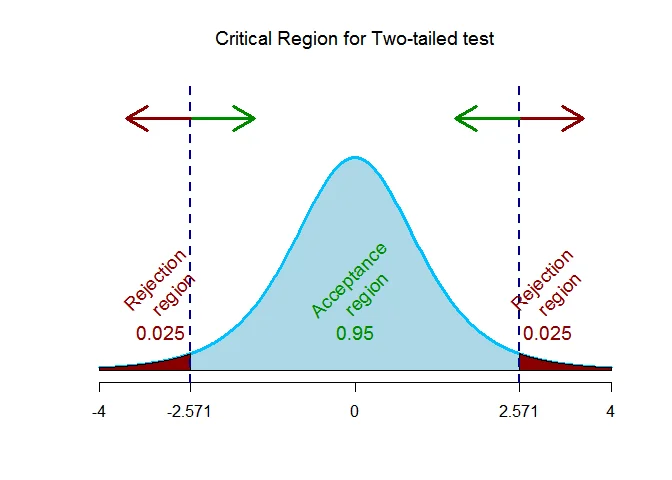
The rejection region (i.e. critical region) is $\text{t < -2.571 or t > 2.571}$.
Step 5 Computation
The test statistic for testing above hypothesis testing problem under the null hypothesis is
$$ \begin{aligned} t&=\frac{\overline{d} -\mu_d}{s_d/\sqrt{n}}\\ &= \frac{-0.9-0}{1.3491/\sqrt{6}}\\ &= -1.6341 \end{aligned} $$
Step 6 Decision (Traditional approach)
The test statistic is $t =-1.6341$ which falls $\textit{outside}$ the critical region, we $\textit{fail to reject}$ the null hypothesis.
OR
Step 6 Decison ($p$-value approach)
The test is $\textit{two-tailed}$ test, so p-value is the area to the $\textit{extreme}$ of the test statistic ($t=-1.6341$). That is p-value = $2*P(t\geq 1.6341 ) = 0.1632$.
The p-value is $0.1632$ which is $\textit{greater than}$ the significance level of $\alpha = 0.05$, we $\textit{fail to reject}$ the null hypothesis at $0.05$ level of significance.
Interpretation
We conclude that the body temperature of the subjects are same at both the times.
Conclusion
I hope you have find above article on Paired t test calculator and examples helpful. You can read more about F test for two variances calculator and chi-square test for variance calculator