Normal Approximation to Binomial Distribution Calculator
Normal approximation allows you to estimate binomial probabilities using the normal distribution. While the binomial distribution is vital tool in statistics used to calculate the probability of success in the a series of independent trials. However, calculating the exact probabilities for the binomial distribution can become tedious, expecially with numerous trials.
The built-in calculator allows you to easily estimate the binomial probabilities using the normal distributions.
Normal Approximation Calculator
| Normal Approximation to Binomial Distribution Calculator | |
|---|---|
| Number of Trials ($n$) | |
| Probability of Success ($p$) | |
| Mean ($\mu=np$) | |
| Standard deviation ($\sqrt{np(1-p)}$) | |
| P(X = A) | |
| P(X < A) | |
| P(X ≤ A) | |
| P(A< X ≤ B) | and |
| P(A ≤ X < B) | and |
| Normal Approximate Calculator Results | |
| Required Probability : | |
How to use Normal Approximation for Binomial Distribution Calculator?
-
Enter the Number of Trails (n) : Input the total number of independent trials.
-
Enter the Probability of Success (p) : Input the probability of success for each trial.
-
Enter the Mean value : The mean value is automatically calculated as the product of the number of trials and the probability of success ($\mu=np$)
-
Enter the Standard Deviation : The standard deviation is automatically calculated using the formula ($\sqrt{np(1-p)}$).
-
Select the Probability : Choose the desired probability calculation option:
- P(X=A) : Calculate the probability of exactly A successes.
- P(X < A) : Calculate the probability of fewer than A successes.
- P(X ≤ A): Calculate the probability of at most A successes.
- P(A< X ≤ B) : Calculate the probability of between A and B successes.
- P(A≤ X < B) : Calculate the probability of between A and B -1 successes.
-
Click on “Calculate” button to compute the result.
-
Calculate Required approximate Probability : The calculated result will display in the “Required Probability” field, providing the approximate probability based on the normal approximation to the binomial distribution.
Let $X$ be a binomially distributed random variable with number of trials $n$ and probability of success $p$.
The mean of $X$ is $\mu=E(X) = np$ and variance of $X$ is $\sigma^2=V(X)=np(1-p)$.
The general rule of thumb to use normal approximation to binomial distribution is that the sample size $n$ is sufficiently large if $np \geq 5$ and $n(1-p)\geq 5$.
For sufficiently large $n$, $X\sim N(\mu, \sigma^2)$. That is $Z=\frac{X-\mu}{\sigma}=\frac{X-np}{\sqrt{np(1-p)}} \sim N(0,1)$.
Normal Approximation to Binomial Distribution Formula
Binomial distribution is a discrete distribution, whereas normal distribution is a continuous distribution. When we are using the normal approximation to Binomial distribution we need to make continuity correction calculation while calculating various probabilities.
- $P(X=A)=P(A-0.5<X<A+0.5)$
- $P(X<A)=P(X<A-0.5)$
- $P(X\leq A)=P(X<A+0.5)$
- $P(A< X\leq B)=P(A-0.5<X<B+0.5)$
- $P(A\leq X< B)=P(A-0.5<X<B-0.5)$
- $P(A\leq X\leq B)=P(A-0.5<X<B+0.5)$
Calculate Approximate Probability
In a certain Binomial distribution with probability of success $p=0.20$ and number of trials $n = 30$.
Calculate approximate probability that
a. the probability of getting 5 successes,
b. the probability of getting at least 5 successes,
c. the probability of getting between 5 and 10 (inclusive) successes.
Solution
Let $X$ denote the number of successes in 30 trials and let $p$ be the probability of success.
Given that $n =30$ and $p=0.2$. Thus $X\sim B(30, 0.2)$.
Here $n*p = 30\times 0.2 = 6>5$ and $n*(1-p) = 30\times (1-0.2) = 24>5$, we use Normal approximation to Binomial distribution.
Mean of $X$ is
$$ \begin{aligned} \mu&= n*p \\ &= 30 \times 0.2 \\ &= 6. \end{aligned} $$
and standard deviation of $X$ is
$$ \begin{aligned} \sigma &= \sqrt{n*p*(1-p)} \\ &= \sqrt{30 \times 0.2 \times (1- 0.2)}\\ &=2.1909. \end{aligned} $$
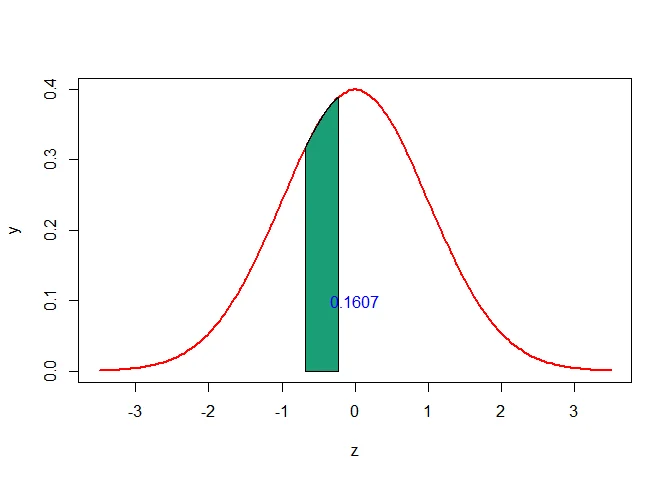
a. Using the continuity correction calculator, $P(X=5)$ can be written as $P(5-0.5<X<5+0.5)=P(4.5<X<5.5)$.
The $Z$-scores that corresponds to $4.5$ and $5.5$ are
$$ \begin{aligned} z_1=\frac{4.5-\mu}{\sigma}=\frac{4.5-6}{2.1909}\approx-0.68 \end{aligned} $$
and
$$ \begin{aligned} z_2=\frac{5.5-\mu}{\sigma}=\frac{5.5-6}{2.1909}\approx-0.23 \end{aligned} $$
Thus the probability of getting exactly 5 successes is
$$ \begin{aligned} P(X= 5) & = P(4.5<X<5.5)\\ &=P(z_1< Z< z_2)\\ &=P(-0.68<Z<-0.23)\\ &=P(Z<-0.23)-P(Z<-0.68)\\ & = 0.409-0.2483\\ & = 0.1607 \end{aligned} $$
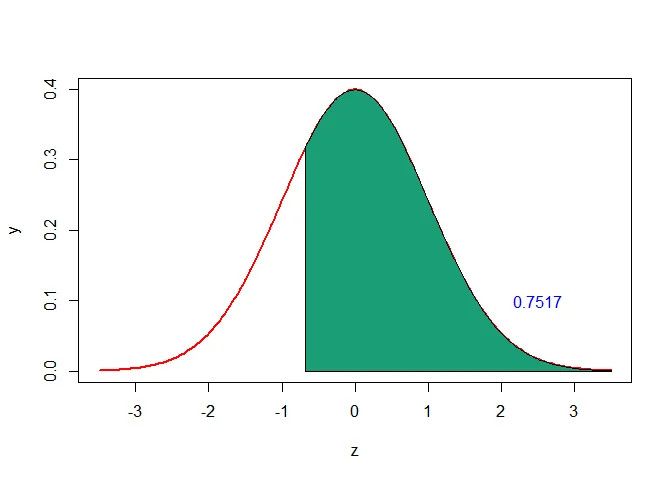
b. Using the continuity correction of normal binomial distribution, the probability of getting at least 5 successes i.e., $P(X\geq 5)$ can be written as $P(X\geq5)=P(X\geq 5-0.5)=P(X\geq4.5)$.
The $Z$-score that corresponds to $4.5$ is
$$ \begin{aligned} z=\frac{4.5-\mu}{\sigma}=\frac{4.5-6}{2.1909}\approx-0.68 \end{aligned} $$
Thus, the probability of getting at least 5 successes is
$$ \begin{aligned} P(X\geq 5) &= P(X\geq4.5)\\ &= 1-P(X<4.5)\\ &= 1-P(Z<-0.68)\\ & = 1-0.2483\\ & = 0.7517 \end{aligned} $$
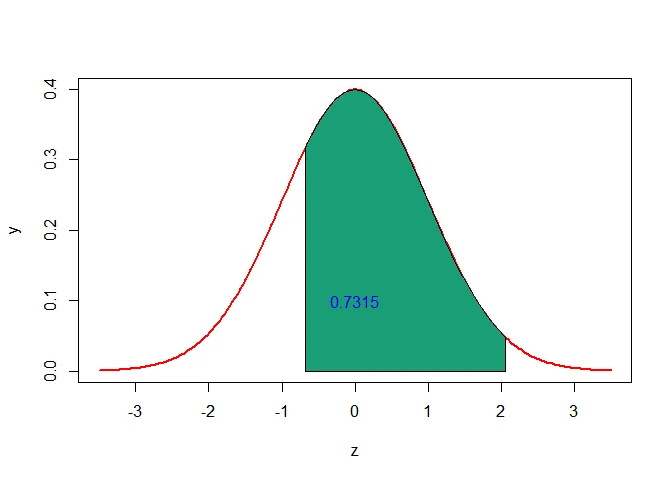
c. Using the continuity correction for normal distribution approximation, the probability of getting between 5 and 10 (inclusive) successes is $P(5\leq X\leq 10)$ can be written as $P(5-0.5<X<10+0.5)=P(4.5<X<10.5)$.
The $Z$-scores that corresponds to $4.5$ and $10.5$ are respectively
$$ \begin{aligned} z_1=\frac{4.5-\mu}{\sigma}=\frac{4.5-6}{2.1909}\approx-0.68 \end{aligned} $$
and
$$ \begin{aligned} z_2=\frac{10.5-\mu}{\sigma}=\frac{10.5-6}{2.1909}\approx2.05 \end{aligned} $$
$$ \begin{aligned} P(5\leq X\leq 10) &= P(5-0.5 < X <10+0.5)\\ &= P(4.5 < X <10.5)\\ &=P(-0.68\leq Z\leq 2.05)\\ &=P(Z\leq 2.05)-P(Z\leq -0.68)\\ &=0.9798-0.2483\\ &=0.7315 \end{aligned} $$
Find the Approximate Probability Based on Normal Approximation to Binomial Distribution
In a large population 40% of the people travel by train. If a random sample of size $n=20$ is selected, then find the approximate probability that
a. exactly 5 persons travel by train,
b. at least 10 persons travel by train,
c. between 5 and 10 (inclusive) persons travel by train.
Solution
Let $X$ denote the number of persons travelling by train out of $20$ selected persons and let $p$ be the probability that a person travel by train.
Given that $n =20$ and $p=0.4$. Thus $X\sim B(20, 0.4)$.
Here $n*p = 20\times 0.4 = 8 > 5$ and $n*(1-p) = 20\times (1-0.4) = 12 > 5$, we use Normal approximation to the Binomial distribution calculation as below:
Mean of $X$ is
$$ \begin{aligned} \mu&= n*p \\ &= 20 \times 0.4 \\ &= 8. \end{aligned} $$
and standard deviation of $X$ is
$$ \begin{aligned} \sigma &= \sqrt{n*p*(1-p)} \\ &= \sqrt{20 \times 0.4 \times (1- 0.4)}\\ &=2.1909. \end{aligned} $$
a. Using the continuity correction calculation, $P(X=5)$ can be written as $P(5-0.5 < X < 5+0.5)=P(4.5 < X < 5.5)$.
The $Z$-scores that corresponds to $4.5$ and $5.5$ are respectively
$$ \begin{aligned} z_1=\frac{4.5-\mu}{\sigma}=\frac{4.5-8}{2.1909}\approx-1.6 \end{aligned} $$
and
$$ \begin{aligned} z_2=\frac{5.5-\mu}{\sigma}=\frac{5.5-8}{2.1909}\approx-1.14 \end{aligned} $$
Thus the probability that exactly $5$ persons travel by train is
$$ \begin{aligned} P(X= 5) & = P(4.5 < X < 5.5)\\ &=P(z_1 < Z < z_2)\\ &=P(-1.6 < Z < -1.14)\\ &=P(Z < -1.14)-P(Z < -1.6)\\ & = 0.1271-0.0548\\ & = 0.0723 \end{aligned} $$
b. Using the continuity correction, the probability that at least $10$ persons travel by train i.e., $P(X\geq 10)$ can be written as $P(X\geq10)=P(X\geq 10-0.5)=P(X\geq9.5)$.
The $Z$-score that corresponds to $9.5$ is
$$ \begin{aligned} z&=\frac{9.5-\mu}{\sigma}\\ &=\frac{9.5-8}{2.1909}\approx0.68 \end{aligned} $$
Thus, the probability that at least 10 persons travel by train is
$$ \begin{aligned} P(X\geq 10) &= P(X\geq9.5)\\ &= 1-P(X < 9.5)\\ &= 1-P(Z < 0.68)\\ & = 1-0.7517\\ & = 0.2483 \end{aligned} $$
c. Using the continuity correction normal binomial distribution, the probability that between $5$ and $10$ (inclusive) persons travel by train i.e., $P(5\leq X\leq 10)$ can be written as $P(5-0.5 < X <10+0.5)=P(4.5 < X < 10.5)$.
The $Z$-scores that corresponds to $4.5$ and $10.5$ are respectively
$$ \begin{aligned} z_1&=\frac{4.5-\mu}{\sigma}\\ &=\frac{4.5-8}{2.1909}\approx-1.6 \end{aligned} $$
and
$$ \begin{aligned} z_2&=\frac{10.5-\mu}{\sigma}\\ &=\frac{10.5-8}{2.1909}\approx1.14 \end{aligned} $$
The probability that between $5$ and $10$ (inclusive) persons travel by train is
$$ \begin{aligned} P(5\leq X\leq 10) &= P(5-0.5 < X < 10+0.5)\\ &= P(4.5 < X <10.5)\\ &=P(-1.6\leq Z\leq 1.14)\\ &=P(Z\leq 1.14)-P(Z\leq -1.6)\\ &=0.8729-0.0548\\ &=0.8181 \end{aligned} $$
Calculate Approximate Probability using Normal Approximation Calculator
Suppose that only 40% of drivers in a certain state wear a seat belt. A random sample of 500 drivers is selected.
Approximate the probability that
a. exactly 215 drivers wear a seat belt,
b. at least 220 drivers wear a seat belt,
c. at the most 215 drivers wear a seat belt,
d. between 210 and 220 drivers wear a seat belt.
Solution
Let $X$ denote the number of drivers who wear seat beltout of 500 selected drivers and let $p$ be the probability that a driver wear seat belt.
Given that $n =500$ and $p=0.4$. Thus $X\sim B(500, 0.4)$.
As $n*p = 500\times 0.4 = 200 > 5$ and $n*(1-p) = 500\times (1-0.4) = 300 > 5$, we use Normal approximation to Binomial distribution.
Mean of $X$ is
$$ \begin{aligned} \mu&= n*p \\ &= 500 \times 0.4 \\ &= 200. \end{aligned} $$
and standard deviation of $X$ is
$$ \begin{aligned} \sigma &= \sqrt{n*p*(1-p)} \\ &= \sqrt{500 \times 0.4 \times (1- 0.4)}\\ &=10.9545. \end{aligned} $$
a. Using the continuity correction for normal approximation to binomial distribution, $P(X=215)$ can be written as $P(215-0.5 < X < 215+0.5)=P(214.5 < X < 215.5)$.
The $Z$-scores that corresponds to $214.5$ and $215.5$ are respectively
$$ \begin{aligned} z_1&=\frac{214.5-\mu}{\sigma}\\ &=\frac{214.5-200}{10.9545}\approx1.32 \end{aligned} $$
and
$$ \begin{aligned} z_2&=\frac{215.5-\mu}{\sigma}\\ &=\frac{215.5-200}{10.9545}\approx1.41 \end{aligned} $$
Thus the probability that exactly $215$ drivers wear a seat belt is
$$ \begin{aligned} P(X= 215) & = P(214.5 < X < 215.5)\\ &=P(z_1 < Z < z_2)\\ &=P(1.32 < Z < 1.41)\\ &=P(Z < 1.41)-P(Z < 1.32)\\ & = 0.9207-0.9066\\ & = 0.0141 \end{aligned} $$
b. By continuity correction normal approximation distribution,the probability that at least 220 drivers wear a seat belt i.e., $P(X\geq 220)$ can be written as $P(X\geq220)=P(X\geq 220-0.5)=P(X\geq219.5)$.
The $Z$-score that corresponds to $219.5$ is
$$ \begin{aligned} z&=\frac{219.5-\mu}{\sigma}\\ &=\frac{219.5-200}{10.9545}\approx1.78 \end{aligned} $$
Thus, the probability that at least $220$ drivers wear a seat belt is
$$ \begin{aligned} P(X\geq 220) &= P(X\geq219.5)\\ &= 1-P(X < 219.5)\\ &= 1-P(Z < 1.78)\\ & = 1-0.9625\\ & = 0.0375 \end{aligned} $$
c. By continuity correction the probability that at most $215$ drivers wear a seat belt i.e., $P(X\leq 215)$ can be written as $P(X\leq215)=P(X\leq 215-0.5)=P(X\leq214.5)$.
The $Z$-score that corresponds to $214.5$ is
$$ \begin{aligned} z&=\frac{214.5-\mu}{\sigma}\\ &=\frac{214.5-200}{10.9545}\approx1.32 \end{aligned} $$
Thus, the approximate probability that at most $215$ drivers wear a seat belt is
$$ \begin{aligned} P(X\leq 215) &= P(X\leq214.5)\\ &= P(X < 214.5)\\ &= P(Z < 1.32)\\ &=0.9066 \end{aligned} $$
d. Using the continuity correction calculator, the probability that between $210$ and $220$ (inclusive) drivers wear seat belt is $P(210\leq X\leq 220)$ can be written as $P(210-0.5 < X < 220+0.5)=P(209.5 < X < 220.5)$.
The $Z$-scores that corresponds to $209.5$ and $220.5$ are respectively
$$ \begin{aligned} z_1&=\frac{209.5-\mu}{\sigma}\\ &=\frac{209.5-200}{10.9545}\approx0.87 \end{aligned} $$
and
$$ \begin{aligned} z_2&=\frac{220.5-\mu}{\sigma}\\ &=\frac{220.5-200}{10.9545}\approx1.87 \end{aligned} $$
The approximate probability that between $210$ and $220$ (inclusive) drivers wear seat belt is
$$ \begin{aligned} P(210\leq X\leq 220) &= P(210-0.5 < X < 220+0.5)\\ &= P(209.5 < X < 220.5)\\ &=P(0.87\leq Z\leq 1.87)\\ &=P(Z\leq 1.87)-P(Z\leq 0.87)\\ &=0.9693-0.8078\\ &=0.1615 \end{aligned} $$
Use Normal Approximation to Binomial Distribution to find Probability
When telephone subscribers call from the National Magazine Subscription Company, 18% of the people who answer stay on the line for more than one minute. If 800 people are called in a day, find the probability that
a. at least 150 stay on the line for more than one minute. (Use normal approximation to binomial).
b. more than 200 stay on the line. (Use normal approximation to Binomial).
Solution
Let $X$ denote the number of people who answer stay online for more than one minute out of 800 people called in a day and let $p$ be the probability people who answer stay online for more than one minute.
Given that $n =800$ and $p=0.18$. Thus $X\sim B(800, 0.18)$.
As $n*p = 800\times 0.18 = 144 > 5$ and $n*(1-p) = 800\times (1-0.18) = 656>5$, we use Normal approximation to Binomial distribution.
Mean of $X$ is
$$ \begin{aligned} \mu&= n*p \\ &= 800 \times 0.18 \\ &= 144. \end{aligned} $$
and standard deviation of $X$ is
$$ \begin{aligned} \sigma &= \sqrt{n*p*(1-p)} \\ &= \sqrt{800 \times 0.18 \times (1- 0.18)}\\ &=10.8665. \end{aligned} $$
a. By continuity correction the probability that at least 150 people stay online for more than one minute i.e., $P(X\geq 150)$ can be written as $P(X\geq150)=P(X\geq 150-0.5)=P(X \geq 149.5)$.
The $Z$-score that corresponds to $149.5$ is
$$ \begin{aligned} z&=\frac{149.5-\mu}{\sigma}\\ &=\frac{149.5-144}{10.8665}\\ &\approx0.51 \end{aligned} $$
Thus, the approximate probability that at least $150$ people stay online for more than one minute is
$$ \begin{aligned} P(X\geq 150) &= P(X\geq149.5)\\ &= 1-P(X < 149.5)\\ &= 1-P(Z < 0.51)\\ & = 1-0.695\\ & \qquad (\text{from normal table})\\ & = 0.305 \end{aligned} $$
b. Using the continuity correction calculator, the probability that more than $150$ people stay online for more than one minute i.e., $P(X > 150)$ can be written as $P(X\geq150)=P(X\geq 150-0.5)=P(X\geq149.5)$.
The $Z$-score that corresponds to $149.5$ is
$$ \begin{aligned} z&=\frac{149.5-\mu}{\sigma}\\ &=\frac{149.5-144}{10.8665}\\ &\approx0.51 \end{aligned} $$
Thus, the approximate probability that at least 150 persons travel by train is
$$ \begin{aligned} P(X\geq 150) &= P(X\geq149.5)\\ &= 1-P(X < 149.5)\\ &= 1-P(Z < 0.51)\\ & = 1-0.695\\ & \qquad (\text{from normal table})\\ & = 0.305 \end{aligned} $$
Find Probability Based on Normal Approximation to Binomial Distribution
60% of all young bald eagles will survive their first flight. If 30 randomly selected young bald eagles are observed, what is the probability that at least 20 of them will survive their first flight?
Solution
Let $X$ denote the number of bald eagles who survive their first flight out of 30 observed bald eagles and let $p$ be the probability that young bald eagle will survive their first flight.
Given that $n =30$ and $p=0.6$. Thus $X\sim B(30, 0.6)$.
As $n*p = 30\times 0.6 = 18 > 5$ and $n*(1-p) = 30\times (1-0.6) = 12 > 5$, we use Normal approximation to Binomial distribution.
Mean of $X$ is
$$ \begin{aligned} \mu&= n*p \\ &= 30 \times 0.6 \\ &= 18. \end{aligned} $$
and standard deviation of $X$ is
$$ \begin{aligned} \sigma &= \sqrt{n*p*(1-p)} \\ &= \sqrt{30 \times 0.6 \times (1- 0.6)}\\ &=2.6833. \end{aligned} $$
a. By continuity correction the probability that at least 20 eagle will survive their first flight, i.e., $P(X\geq 20)$ can be written as $P(X\geq20)=P(X\geq 20-0.5)=P(X \geq 19.5)$.
The $Z$-score that corresponds to $19.5$ is
$$ \begin{aligned} z&=\frac{19.5-\mu}{\sigma}\\ &=\frac{19.5-18}{2.6833}\\ &\approx0.56 \end{aligned} $$
Thus, the approximate probability that at least $20$ eagle will survive their first flight is
$$ \begin{aligned} P(X\geq 20) &= P(X\geq19.5)\\ &= 1-P(X < 19.5)\\ &= 1-P(Z < 0.56)\\ & = 1-0.7123\\ & \qquad (\text{from normal table})\\ & = 0.2877 \end{aligned} $$
Continuity Correction Examples
Use normal approximation to estimate the probability of getting 90 to 105 sixes (inclusive of both 90 and 105) when a die is rolled 600 times.
a. Without continuity correction b. With continuity correction
Solution
Let $X$ denote the number of sixes when a die is rolled 600 times and let $p$ be the probability of getting six.
Given that $n =600$ and $p=0.1667$. Thus $X\sim B(600, 0.1667)$.
Mean of $X$ is
$$ \begin{aligned} \mu&= n*p \\ &= 600 \times 0.1667 \\ &= 100.02. \end{aligned} $$
and standard deviation of $X$ is
$$ \begin{aligned} \sigma &= \sqrt{n*p*(1-p)} \\ &= \sqrt{600 \times 0.1667 \times (1- 0.1667)}\\ &=9.1294. \end{aligned} $$
a. Without continuity correction calculation
The $Z$-scores that corresponds to $90$ and $105$ are respectively
$$ \begin{aligned} z_1&=\frac{90-\mu}{\sigma}\\ &=\frac{90-100.02}{9.1294}\\ &\approx-1.1 \end{aligned} $$
and
$$ \begin{aligned} z_2&=\frac{105-\mu}{\sigma}\\ &=\frac{105-100.02}{9.1294}\\ &\approx0.55 \end{aligned} $$
$$ \begin{aligned} P(90\leq X\leq 105) &=P(-1.1\leq Z\leq 0.55)\\ &=P(Z\leq 0.55)-P(Z\leq -1.1)\\ &=0.7088-0.1357\\ & \qquad (\text{from normal table})\\ &=0.5731 \end{aligned} $$
b. Normal Approximation with continuity correction
As $n*p = 600\times 0.1667 = 100.02 > 5$ and $n*(1-p) = 600\times (1-0.1667) = 499.98 > 5$, we use Normal approximation to Binomial distribution calculator.
Using the continuity correction, the approximate probability of getting between $90$ and $105$ (inclusive) sixes i.e., $P(90\leq X\leq 105)$ can be written as $P(90-0.5 < X < 105+0.5)=P(89.5 < X < 105.5)$.
The $Z$-scores that corresponds to $89.5$ and $105.5$ are respectively
$$ \begin{aligned} z_1&=\frac{89.5-\mu}{\sigma}\\ &=\frac{89.5-100.02}{9.1294}\\ &\approx-1.15 \end{aligned} $$
and
$$ \begin{aligned} z_2&=\frac{105.5-\mu}{\sigma}\\ &=\frac{105.5-100.02}{9.1294}\\ &\approx0.6 \end{aligned} $$
$$ \begin{aligned} P(90\leq X\leq 105) &= P(90-0.5 < X < 105+0.5)\\ &= P(89.5 < X < 105.5)\\ &=P(-1.15\leq Z\leq 0.6)\\ &=P(Z\leq 0.6)-P(Z\leq -1.15)\\ &=0.7257-0.1251\\ & \qquad (\text{from normal table})\\ &=0.6006 \end{aligned} $$
Conclusion
I Hope you like Normal Approximation to Binomial Distribution Calculator and step by step guide with examples and calculator. Click on Theory button to read more about Normal approximation to bionomial distribution.
Read more about other Statistics Calculator on below links