To create a pie chart in R, you can use three different ways using base R, using ggplot2 package or using plotrix library.
The following methods show how you can do it with syntax.
Method 1: Use pie() Function
pie(values, labels = labels, main = "Pie Chart")
Method 2: Use ggplot() Function
library(ggplot2)
ggplot(df, aes(x = "", fill = category, weight = value)) +
  geom_bar(width = 1) +
  coord_polar("y", start = 0) +
  labs(x = NULL, y = NULL, fill = NULL, title = "Pie Chart")
Method 3: Use pie3D() Function
library(plotrix)

pie3D(values,labels = label,explode = 0.1, main = "Pie Chart 3d image")
The following examples show how to create a pie chart in R.
Use pie() Function
Let’s see how we can use pie() function to create pie chart:
# Sample data
values <- c(15, 25, 40)
labels <- c("X", "Y", "Z")

# Build the pie chart
pie(values, labels = labels, main = "My Pie Chart")
Output:
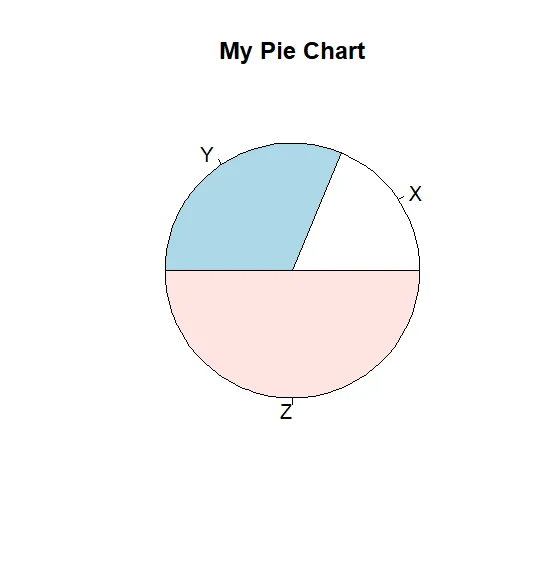
The above snippet shows pie chart created using pie() function.
Using ggplot() Function
Let’s see how we can create pie chart using ggplot() function from ggplot2 package:
install.packages("ggplot2")

library(ggplot2)

df <- data.frame(Start_date=as.Date(c("2000-05-21","2000-05-22","2000-05-23","2000-05-24","2000-05-25","2000-05-26")),
                 Machine_name = c("Machine1","Machine2","Machine1","Machine3","Machine2","Machine3"),
                 Value = c(108,120,135,95,98,105),Reading= c(110,97,91,89,80,85))

# Build the pie chart
ggplot(df, aes(x = "", y = Value, fill = Machine_name)) +
  geom_bar(stat = "identity", width = 1, color = "black") +
  coord_polar("y") +
  labs(title = "Machine data distribution") +
  theme_minimal() +
  theme(axis.text = element_blank(),
        axis.title = element_blank(),
        legend.position = "bottom")
Output:
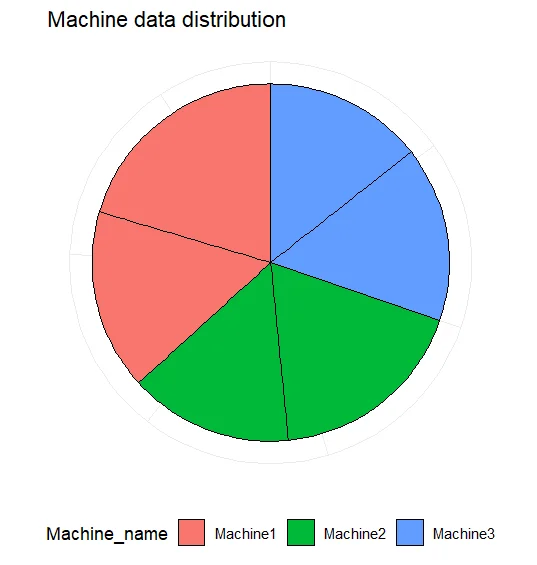
As in the above code we first create data frame and based on that we plot pie chart.
Using pie3D() Function
Let’s see how we can create 3D pie chart using pie3D() function from plotrix package:
install.packages("plotrix")

# Get the library.
library(plotrix)

# Create data for the graph.
values <- c(15, 25, 40)
label <- c("X", "Y", "Z")

# Build the pie chart
pie3D(values,labels = label,explode = 0.1, main = "Pie Chart 3d image")
Output:
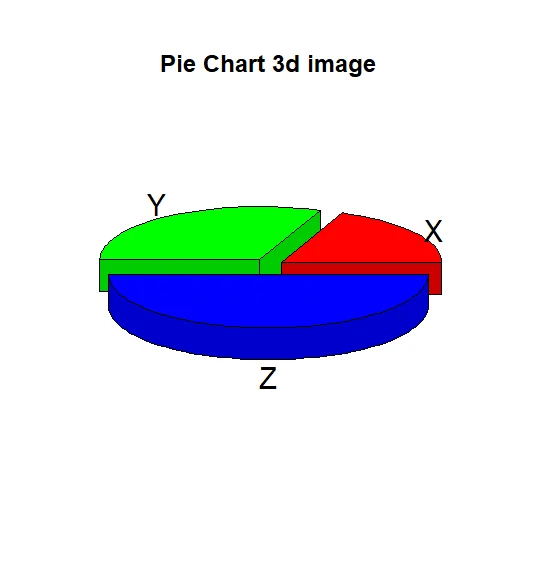
As in the above R script we declare values and labels for the 3d pie chart then using this data we plot 3d pie chart.