To find and and visualize quartile values in R, you can use quantile() function boxplot() function respectively.
The following methods show how you can do it with syntax.
Method: Use quantile() Function
quantile(data)
Method: Use boxplot() Function
boxplot(data, ylab = "y", xlab = "x", main = "Boxplot with Quartiles")
The following examples show how to find and visualize quartile values in R using quantile() and boxplot() function.
Using quantile() Function
Let’s see how we can use quantile() function in R:
# Create dataset
data = c(12,14,15,56,85,96,12.3,8.25,85.63,99.12)

# Calculate quartiles values of dataset
q <- quantile(data)

# Print quartiles values
print(q)
Output:
  0%     25%     50%     75%    100%
 8.2500 12.7250 35.5000 85.4725 99.1200
Here the output shows quartile values for dataset that we define in above code. The quantile() function gives quartile values of 0%, 25%, 50%, 75% and 100%.
Using boxplot() Function
Let’s see how we can use boxplot() function to visualize quartile values:
# Create dataset
data = c(12,14,15,56,85,96,12.3,8.25,85.63,99.12)

# Plot boxplot
boxplot(data, ylab = "Values", xlab = "Data", main = "Boxplot with Quartiles")
Output:
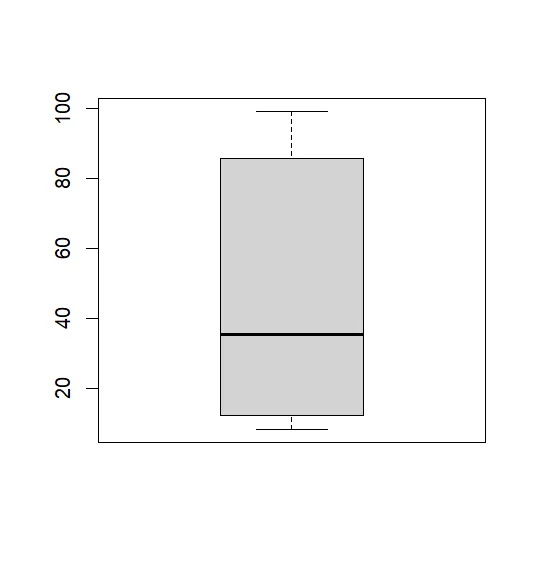
Here the above snippet shows boxplot for dataset that we declare in above code.