To plot equation in R, you can use curve() function or ggplot2 package.
The following methods show how you can do it with syntax.
Method 1: Use curve() Function
curve(equation, from=-10, to=10, , xlab="x", ylab="y")
Method 2: Use ggplot2 Package
library(ggplot2)

ggplot(data.frame(m=c(-10, 10)), aes(m=m)) +
  stat_function(fun=equation)
The following examples show how to plot equation in R using two different ways.
Using curve() Function
Let’s see how we can use curve() function in R:
curve(9*m^3+8, from=1, to=50, , xlab="m", ylab="n")
Output:
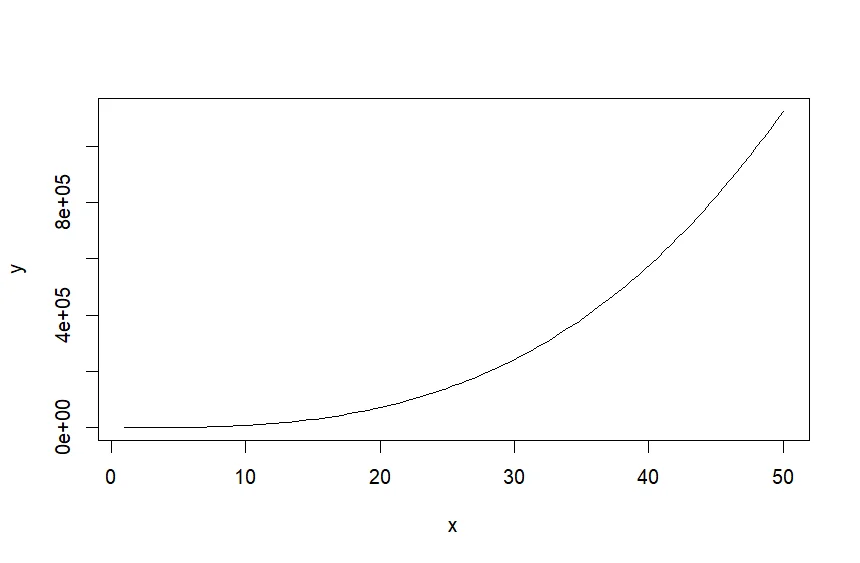
Here the above snippet shows curve is created by plotting equation in R.
Using ggplot2 Package
Let’s see how we can use ggplot2 package in R:
library(ggplot2)

#define equation
equation <- function(m){9*m^3+8}

#plot equation
ggplot(data.frame(m=c(1, 50)), aes(m=m)) +
  stat_function(fun=equation)
Output:
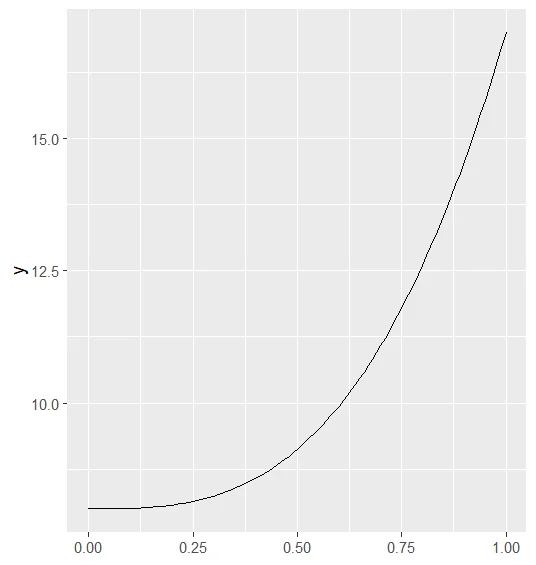
Here the above snippet shows curve created using ggplot2 package.