Two Sample $t$-Test (Independent Sample with Unequal Variances)
In this tutorial we will discuss some numerical examples on two sample t test for difference between two population means when the population variances are unknown and unequal.
Example 1
A statistician claims that the average score on logical reasoning test taken by students who major in Physics is less than that of students who major in English. The result of the exams, given to 22 Physics students and 33 English students, is shown here. Is there enough evidence to reject the statistician’s claim at $\alpha= 0.05$? Assume that the standard deviations for the two populations are not equal.
| . | Physics Major | English Major |
|---|---|---|
| Sample Mean | 85 | 76 |
| sample SD | 19 | 23 |
| Sample size | 22 | 33 |
Solution
Given that the sample size $n_1 = 22$, $n_2 = 33$, sample mean $\overline{x}_1= 85$, $\overline{x}_2= 76$, sample standard deviation $s_1 = 19$ and $s_2 = 23$.
Step 1 State the hypothesis testing problem
The hypothesis testing problem is $H_0 : \mu_1 = \mu_2$ against $H_1 : \mu_1 < \mu_2$ ($\textit{left-tailed}$)
Step 2 Define test statistic
The test statistic for testing above hypothesis testing problem is
$$ \begin{aligned} t=\frac{(\overline{x}_1 -\overline{x}_1)-(\mu_1 - \mu_2)}{\sqrt{\frac{s_1^2}{n_1}+\frac{s_2^2}{n_2}}} \end{aligned} $$
The test statistic $t$ follows Students’ $t$ distribution with $\nu$ degrees of freedom, where
$$ \begin{aligned} \nu = \frac{\bigg(\frac{s_1^2}{n_1}+\frac{s_2^2}{n_2}\bigg)^2}{\frac{s_1^4}{n_1^2(n_1-1)}+\frac{s_2^4}{n_2^2(n_2-1)}}=50 \end{aligned} $$
rounded to nearest integer.
Step 3 Level of significance
The significance level is $\alpha = 0.05$.
Step 4 Determine the critical value
As the alternative hypothesis is $\textit{left-tailed}$, the critical value of $t$ using $\alpha = 0.05$ and degrees of freedom $=50$ $\text{is}$ $\text{-1.676}$.
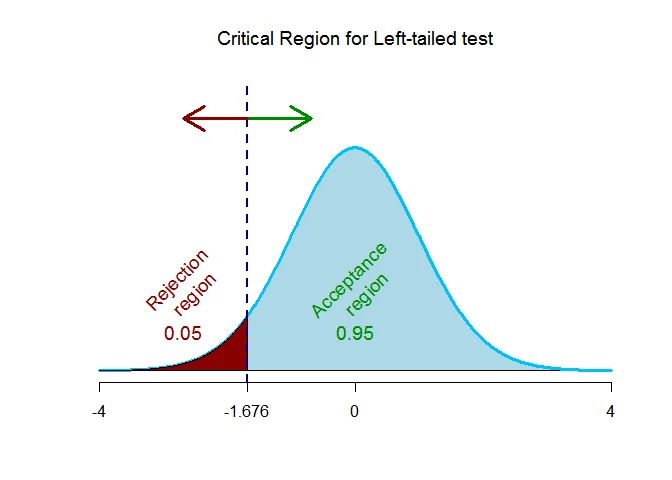
The rejection region (i.e. critical region) is $\text{t < -1.676}$.
Step 5 Computation
The test statistic for testing above hypothesis testing problem under the null hypothesis is
$$ \begin{aligned} t&=\frac{(\overline{x}_1 -\overline{x}_1)-0}{\sqrt{\frac{s_1^2}{n_1}+\frac{s_2^2}{n_2}}}\\ &= \frac{(85-76)}{\sqrt{\frac{19^2}{22}+\frac{23^2}{33}}}\\ &= 1.5802 \end{aligned} $$
Step 6 Decision (Traditional approach)
The rejection region (i.e. critical region) is $\text{t < -1.676}$. The test statistic is $t =1.5802$ which falls $\text{outside}$ the critical region, we $\textit{fail to reject}$ the null hypothesis.
OR
Step 6 Decision ($p$-value approach)
The test is $\textit{left-tailed}$ test, so p-value is the area to the $\textit{left}$ of the test statistic ($t=1.5802$). That is p-value = $P(t\leq 1.5802 ) = 0.9398$.
The p-value is $0.9398$ which is $\textit{greater than}$ the significance level of $\alpha = 0.05$, we $\textit{fail to reject}$ the null hypothesis.
Example 2
Suppose we wanted to test the hypothesis that a control group of cancer patients (Group 1) would report higher mean pain ratings than an experimental group receiving special massage treatments (Group 2). Use the following information to test the hypothesis at $\alpha =0.05$:
| . | Control (Group 1) | Treatment (Group 2) |
|---|---|---|
| Sample mean | 78.1 | 75.1 |
| Sample SD | 42.1 | 39.7 |
| Sample size | 25 | 25 |
Solution
Given that the sample size $n_1 = 25$, $n_2 = 25$, sample mean $\overline{x}_1= 78.1$, $\overline{x}_2= 75.1$, sample standard deviation $s_1 = 42.1$ and $s_2 = 39.7$.
Step 1 State the hypothesis testing problem
The hypothesis testing problem is $H_0 : \mu_1 = \mu_2$ against $H_1 : \mu_1 > \mu_2$ ($\textit{right-tailed}$)
Step 2 Define test statistic
The test statistic for testing above hypothesis testing problem is
$$ \begin{aligned} t=\frac{(\overline{x}_1 -\overline{x}_1)-(\mu_1 - \mu_2)}{\sqrt{\frac{s_1^2}{n_1}+\frac{s_2^2}{n_2}}} \end{aligned} $$
The test statistic $t$ follows Students’ $t$ distribution with $\nu$ degrees of freedom, where
$$ \begin{aligned} \nu = \frac{\bigg(\frac{s_1^2}{n_1}+\frac{s_2^2}{n_2}\bigg)^2}{\frac{s_1^4}{n_1^2(n_1-1)}+\frac{s_2^4}{n_2^2(n_2-1)}}=48 \end{aligned} $$
rounded to nearest integer.
Step 3 Level of significance
The significance level is $\alpha = 0.05$.
Step 4 Determine the critical value
As the alternative hypothesis is $\textit{right-tailed}$, the critical value of $t$ using $\alpha = 0.05$ and degrees of freedom $=48$ $\text{is}$ $\text{1.677}$.
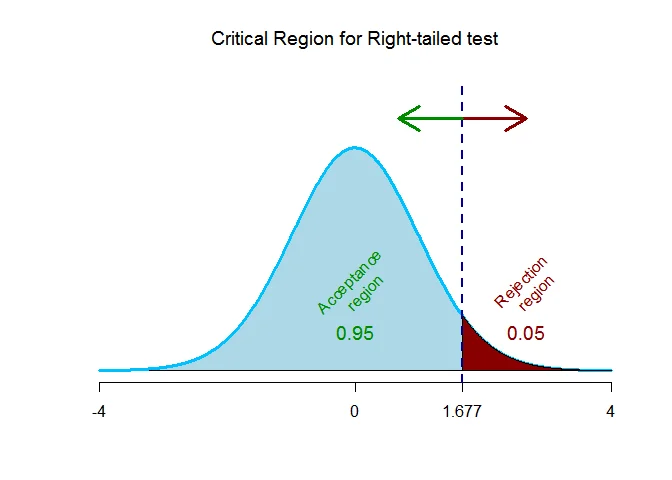
The rejection region (i.e. critical region) is $\text{t > 1.677}$.
Step 5 Computation
The test statistic for testing above hypothesis testing problem under the null hypothesis is
$$ \begin{aligned} t&=\frac{(\overline{x}_1 -\overline{x}_1)-0}{\sqrt{\frac{s_1^2}{n_1}+\frac{s_2^2}{n_2}}}\\ &= \frac{(78.1-75.1)}{\sqrt{\frac{42.1^2}{25}+\frac{39.7^2}{25}}}\\ &= 0.2592 \end{aligned} $$
Step 6 Decision (Traditional approach)
The rejection region (i.e. critical region) is $\text{t > 1.677}$. The test statistic is $t =0.2592$ which falls $\text{outside}$ the critical region, we $\textit{fail to reject}$ the null hypothesis.
OR
Step 6 Decision ($p$-value approach)
The test is $\textit{right-tailed}$ test, so p-value is the area to the $\textit{right}$ of the test statistic ($t=0.2592$). That is p-value = $P(t\geq 0.2592 ) = 0.3983$.
The p-value is $0.3983$ which is $\textit{greater than}$ the significance level of $\alpha = 0.05$, we $\textit{fail to reject}$ the null hypothesis.
Example 3
Two methods were used to measure the brightness of independent clay samples. The following table display the summary statistics for the two independent samples. We are interested in the difference between the two population means for the two methods. Assume that brightness measurements are normally distributed. Also assume that the population variances are unequal.
Method A : $\overline{x}_1= 91.6$, $s_1 = 2.3$ and $n_1 = 12$
Method B : $\overline{x}_2= 92.5$, $s_2 = 1.6$ and $n_2 = 12$
Setup the hypothesis problem and test at $\alpha = 0.01$ level of significance.
Solution
Given that the sample size $n_1 = 12$, $n_2 = 12$, sample mean $\overline{x}_1= 91.6$, $\overline{x}_2= 92.5$, sample standard deviation $s_1 = 2.3$ and $s_2 = 1.6$.
Step 1 State the hypothesis testing problem
The hypothesis testing problem is $H_0 : \mu_1 = \mu_2$ against $H_1 : \mu_1 \neq \mu_2$ ($\textit{two-tailed}$)
Step 2 Define test statistic
The test statistic for testing above hypothesis testing problem is
$$ \begin{aligned} t=\frac{(\overline{x}_1 -\overline{x}_1)-(\mu_1 - \mu_2)}{\sqrt{\frac{s_1^2}{n_1}+\frac{s_2^2}{n_2}}} \end{aligned} $$
The test statistic $t$ follows Students’ $t$ distribution with $\nu$ degrees of freedom, where
$$ \begin{aligned} \nu = \frac{\bigg(\frac{s_1^2}{n_1}+\frac{s_2^2}{n_2}\bigg)^2}{\frac{s_1^4}{n_1^2(n_1-1)}+\frac{s_2^4}{n_2^2(n_2-1)}}=20 \end{aligned} $$
rounded to nearest integer.
Step 3 Level of significance
The significance level is $\alpha = 0.01$.
Step 4 Determine the critical value
As the alternative hypothesis is $\textit{two-tailed}$, the critical value of $t$ using $\alpha = 0.01$ and degrees of freedom $=20$ $\text{are}$ $\text{-2.845 and 2.845}$.
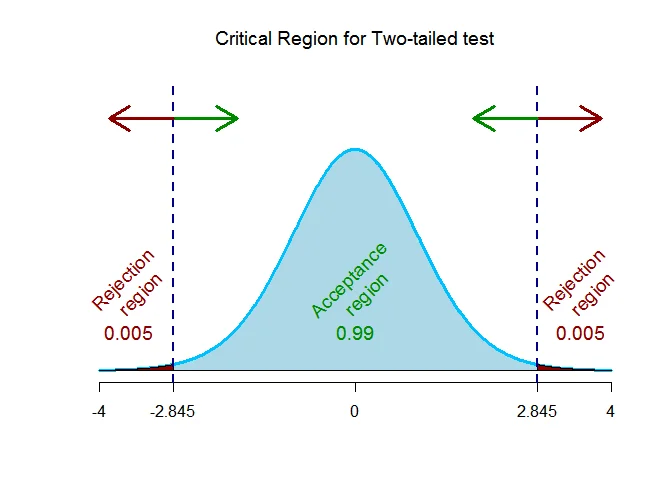
The rejection region (i.e. critical region) is $\text{t < -2.845 or t > 2.845}$.
Step 5 Computation
The test statistic for testing above hypothesis testing problem under the null hypothesis is
$$ \begin{aligned} t&=\frac{(\overline{x}_1 -\overline{x}_1)-0}{\sqrt{\frac{s_1^2}{n_1}+\frac{s_2^2}{n_2}}}\\ &= \frac{(91.6-92.5)}{\sqrt{\frac{2.3^2}{12}+\frac{1.6^2}{12}}}\\ &= -1.1128 \end{aligned} $$
Step 6 Decision (Traditional approach)
The rejection region (i.e. critical region) is $\text{t < -2.845 or t > 2.845}$. The test statistic is $t =-1.1128$ which falls $\text{outside}$ the critical region, we $\textit{fail to reject}$ the null hypothesis.
OR
Step 6 Decision ($p$-value approach)
The test is $\textit{two-tailed}$ test, so p-value is the area to the $\textit{extreme}$ of the test statistic ($t=-1.1128$). That is p-value = $2*P(t\geq 1.1128 ) = 0.279$.
The p-value is $0.279$ which is $\textit{greater than}$ the significance level of $\alpha = 0.01$, we $\textit{fail to reject}$ the null hypothesis.