Testing Correlation Coefficient
In this tutorial we will discuss step by step solution of numerical problems on testing whether the population correlation coefficient is $\rho_0$ or not.
Example 1
The median records shows that the correlation between the age of the mother and the birth weight of their first child is less than -0.34. A random sample of 8 mother’s age and the birth weight of their first child are as follows:
| Age of mother | 35 | 24 | 28 | 29 | 26 | 30 | 34 | 32 |
|---|---|---|---|---|---|---|---|---|
| Birth weight of child | 2.85 | 3.50 | 3.25 | 3.00 | 3.25 | 2.75 | 2.90 | 3.00 |
Test whether the medical records provide the true information at 5% level of significance.
Solution
Let $x$ denote the age of mother and $y$ denote the birth weight of first child.
The number of pairs $n= 8$.
| $x$ | $y$ | $x^2$ | $y^2$ | $xy$ | |
|---|---|---|---|---|---|
| 1 | 35 | 2.85 | 1225 | 8.123 | 99.75 |
| 2 | 24 | 3.50 | 576 | 12.250 | 84.00 |
| 3 | 28 | 3.25 | 784 | 10.562 | 91.00 |
| 4 | 29 | 3.00 | 841 | 9.000 | 87.00 |
| 5 | 26 | 3.25 | 676 | 10.562 | 84.50 |
| 6 | 30 | 2.75 | 900 | 7.562 | 82.50 |
| 7 | 34 | 2.90 | 1156 | 8.410 | 98.60 |
| 8 | 32 | 3.00 | 1024 | 9.000 | 96.00 |
| Total | 238 | 24.50 | 7182 | 75.470 | 723.35 |
The sample variance of $x$ is
$$ \begin{aligned} s_{x}^2 & = \frac{1}{n-1}\bigg(\sum x^2 - \frac{(\sum x)^2}{n}\bigg)\\ & = \frac{1}{8-1}\bigg(7182-\frac{(238)^2}{8}\bigg)\\ &= \frac{1}{7}\bigg(7182-\frac{56644}{8}\bigg)\\ &= \frac{1}{7}\bigg(7182-7080.5\bigg)\\ &= \frac{101.5}{7}\\ &= 14.5. \end{aligned} $$
The sample variance of $x$ is
$$ \begin{aligned} s_{y}^2 & = \frac{1}{n-1}\bigg(\sum y^2 - \frac{(\sum y)^2}{n}\bigg)\\ & = \frac{1}{8-1}\bigg(75.47-\frac{(24.5)^2}{8}\bigg)\\ &= \frac{1}{7}\bigg(75.47-\frac{600.25}{8}\bigg)\\ &= \frac{1}{7}\bigg(75.47-75.0312\bigg)\\ &= \frac{0.4387}{7}\\ &= 0.0627. \end{aligned} $$
The sample covariance between $x$ and $y$ is
$$ \begin{aligned} s_{xy} & = \frac{1}{n-1}\bigg(\sum xy - \frac{(\sum x)(\sum y)}{n}\bigg)\\ & = \frac{1}{8-1}\bigg(723.35-\frac{(238)(24.5)}{8}\bigg)\\ &= \frac{1}{7}\bigg(723.35-\frac{5831}{8}\bigg)\\ &= \frac{1}{7}\bigg(723.35-728.875\bigg)\\ &= \frac{-5.525}{7}\\ &= -0.7893. \end{aligned} $$
The Karl Pearson’s sample correlation coefficient between age of mother and birth weight of first child is
$$ \begin{aligned} r_{xy} & = \frac{Cov(x,y)}{\sqrt{V(x) V(y)}}\\ &= \frac{s_{xy}}{\sqrt{s_x^2s_y^2}}\\ &=\frac{-0.7893}{\sqrt{14.5\times 0.0627}}\\ &=\frac{-0.7893}{\sqrt{0.9092}}\\ &=-0.828. \end{aligned} $$
The correlation coefficient between age of mother and birth weight of first child is $-0.828$.
Step 1 Hypothesis Testing Problem
The hypothesis testing problem is $H_0 : \rho = -0.34$ against $H_1 : \rho < -0.34$ ($\text{left-tailed}$)
Step 2 Test Statistic
The test statistic for testing above hypothesis testing problem is
$$ \begin{aligned} Z&=\dfrac{U-\xi}{\sqrt{\frac{1}{n-3}}} \end{aligned} $$
where
$$ \begin{aligned} U&=\frac{1}{2}\log_e \bigg(\frac{1+r}{1-r}\bigg) \end{aligned} $$
and
$$ \begin{aligned} \xi & =\frac{1}{2}\log_e \bigg(\frac{1+\rho_0}{1-\rho_0}\bigg) \end{aligned} $$
Under the null hypothesis the test statistic $Z$ follows $N(0,1)$ distribution.
Step 3 Significance Level
The significance level is $\alpha = 0.05$.
Step 4 Critical Value(s)
As the alternative hypothesis is $\text{left-tailed}$, the critical value of $Z$ $\text{is}$ $-1.64$ (from Normal Statistical Table).
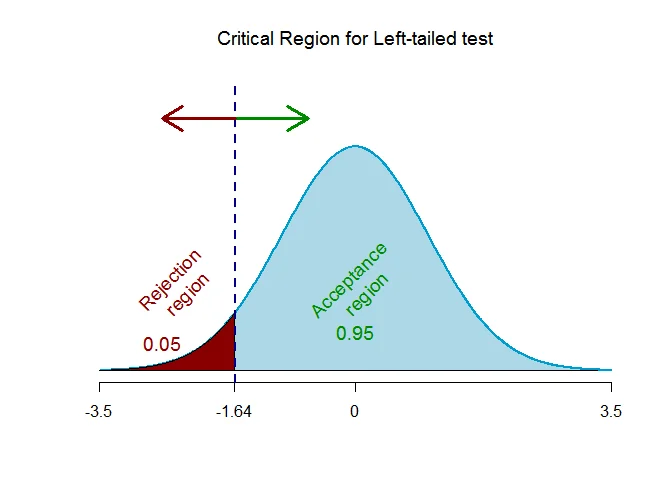
The rejection region (i.e. critical region) is $\text{Z < -1.64}$.
Step 5 Computation
$$ \begin{aligned} U&=\frac{1}{2}\log_e \bigg(\frac{1+r}{1-r}\bigg)\\ &=0.5\times \log_e\bigg(\frac{1+(-0.828)}{1-(-0.828)}\bigg)\\ &=0.5\times \log_e\big(0.0941\big)\\ &=0.5\times -2.3635\\ &= -1.1817 \end{aligned} $$
and
$$ \begin{aligned} \xi&=\frac{1}{2}\log_e \bigg(\frac{1+\rho_0}{1-\rho_0}\bigg)\\ &=0.5\times \log_e\bigg(\frac{1+(-0.34)}{1-(-0.34)}\bigg)\\ &=0.5\times \log_e\big(0.4925\big)\\ &=0.5\times -0.7082\\ &= -0.3541 \end{aligned} $$
The test statistic under the null hypothesis is
$$ \begin{aligned} Z&=\dfrac{U-\xi}{\sqrt{\frac{1}{n-3}}}\\ &=\dfrac{-1.1817-(-0.3541)}{\sqrt{\frac{1}{8-3}}}\\ &=\dfrac{-0.8276}{\sqrt{\frac{1}{5}}}\\ &=-1.8507 \end{aligned} $$
Step 6 Decision (Traditional Approach)
The test statistic is $Z_{obs} =-1.851$ which falls $\text{inside}$ the critical region, we $\text{reject}$ the null hypothesis at $\alpha = 0.05$ level of significance.
OR
Step 6 Decision ($p$-value Approach)
This is a $\text{left-tailed}$ test, so the p-value is the area to the $\text{negative}$ of the test statistic ($Z_{obs}=-1.851$) is p-value = $0.0321$.
The p-value is $0.0321$ which is $\text{less than}$ the significance level of $\alpha = 0.05$, we $\text{reject}$ the null hypothesis at $\alpha =0.05$ level of significance.
Interpretation
There is enough evidence to conclude that the medical records provide true information at $0.05$ level of significance.
Example 2
The correlation between scores on a traditional aptitude test and scores on a final test is known to be approximately 0.6. A new aptitude test has been developed and is tried on a random sample of 100 students, resulting in a correlation of 0.65. Does this result imply that the new test is better?
Solution
Given that the sample correlation between $X$ and $Y$ is $0.65$ for a sample of $100$ pair of observations.
Step 1 Hypothesis Testing Problem
The hypothesis testing problem is $H_0 : \rho = 0.6$ against $H_1 : \rho > 0.6$ ($\text{right-tailed}$)
Step 2 Test Statistic
The test statistic for testing above hypothesis testing problem is
$$ \begin{aligned} Z&=\dfrac{U-\xi}{\sqrt{\frac{1}{n-3}}} \end{aligned} $$
where
$$ \begin{aligned} U&=\frac{1}{2}\log_e \bigg(\frac{1+r}{1-r}\bigg) \end{aligned} $$
and
$$ \begin{aligned} \xi & =\frac{1}{2}\log_e \bigg(\frac{1+\rho_0}{1-\rho_0}\bigg) \end{aligned} $$
Under the null hypothesis the test statistic $Z$ follows $N(0,1)$ distribution.
Step 3 Significance Level
The significance level is $\alpha = 0.05$.
Step 4 Critical Value(s)
As the alternative hypothesis is $\text{right-tailed}$, the critical value of $Z$ $\text{is}$ $1.64$ (from Normal Statistical Table).
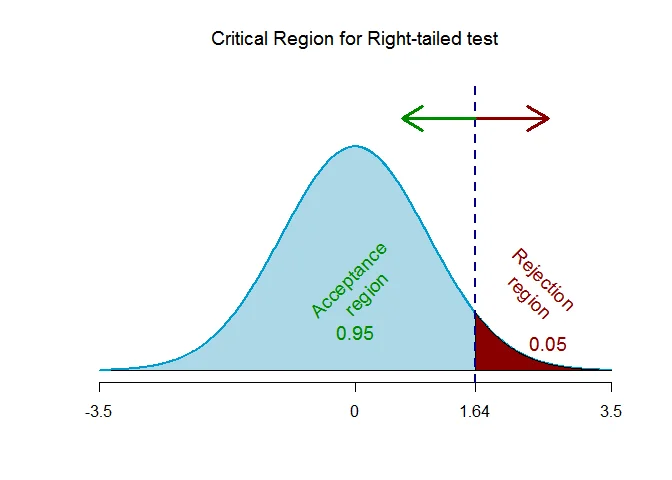
The rejection region (i.e. critical region) is $\text{Z > 1.64}$.
Step 5 Computation
$$ \begin{aligned} U&=\frac{1}{2}\log_e \bigg(\frac{1+r}{1-r}\bigg)\\ &=0.5\times \log_e\bigg(\frac{1+0.65}{1-0.65}\bigg)\\ &=0.5\times \log_e\big(4.7143\big)\\ &=0.5\times 1.5506\\ &= 0.7753 \end{aligned} $$
and
$$ \begin{aligned} \xi&=\frac{1}{2}\log_e \bigg(\frac{1+\rho_0}{1-\rho_0}\bigg)\\ &=0.5\times \log_e\bigg(\frac{1+0.6}{1-0.6}\bigg)\\ &=0.5\times \log_e\big(4\big)\\ &=0.5\times 1.3863\\ &= 0.6931 \end{aligned} $$
The test statistic under the null hypothesis is
$$ \begin{aligned} Z&=\dfrac{U-\xi}{\sqrt{\frac{1}{n-3}}}\\ &=\dfrac{0.7753-0.6931}{\sqrt{\frac{1}{100-3}}}\\ &=\dfrac{0.0822}{\sqrt{\frac{1}{97}}}\\ &=0.8091 \end{aligned} $$
Step 6 Decision (Traditional Approach)
The test statistic is $Z_{obs} =0.809$ which falls $\text{outside}$ the critical region, we $\text{fail to reject}$ the null hypothesis at $\alpha = 0.05$ level of significance.
OR
Step 6 Decision ($p$-value Approach)
This is a $\text{right-tailed}$ test, so the p-value is the area to the $\text{right}$ of the test statistic ($Z_{obs}=0.809$) is p-value = $0.2092$.
The p-value is $0.2092$ which is $\text{greater than}$ the significance level of $\alpha = 0.05$, we $\text{fail to reject}$ the null hypothesis at $\alpha =0.05$ level of significance.
Interpretation
There is insufficient evidence to conclude that the new test is better.