The corrplot() function is used to plot correlation matrix in R.
The following method shows how you can do it with syntax.
Method 1: Use corrplot() Function
library(corrplot)

corrplot(correlation_matrix)
The following example shows how to use corrplot() function to plot correlation matrix in R.
Using corrplot() Function
Suppose we want to plot correlation matrix created from dataframe then we first need to use cor() function and after this you plot correlation matrix:
# Import library
library(corrplot)

# Create data frame
df <- data.frame(Pressure1=c(78.2, 88.2, 71.7, 80.21, 84.21, 82.56, 72.12, 73.85),
                 Temperature=c(35, 36, 37, 38, 32, 30, 31, 34),
                  Pressure2=c(12, 13, 11, 12, 14, 15, 13, 15))

# Create correlation matrix with circles inside matrix
corrplot(cor(df))
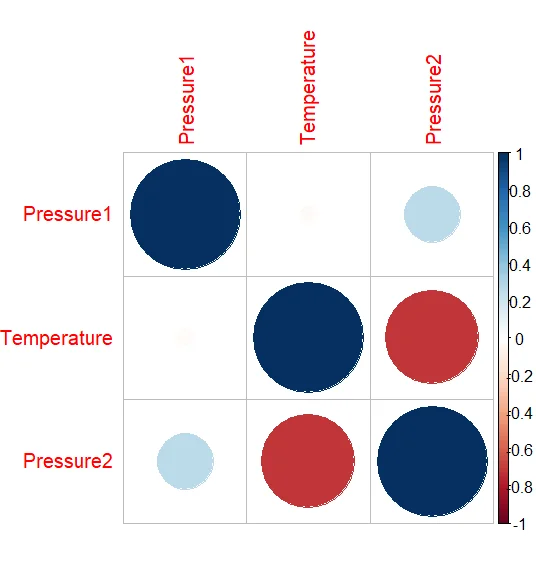
Here the above snippet shows plot of correlation matrix created from dataframe.